Resources
.webp)
Coastal Insurers Turn to ZestyAI for Property Intelligence
As catastrophe volatility reshapes underwriting in coastal states, insurers are increasingly turning to property-level intelligence to better understand exposure and manage portfolio risk. Southern Oak Insurance Company and Lilypad-Centauri Insurance recently turned to ZestyAI’s analytics to strengthen underwriting in hurricane-exposed markets.
Two insurers operating in hurricane-exposed coastal markets — Southern Oak Insurance Company and Lilypad-Centauri Insurance — are using the ZestyAI platform to bring greater structure-level insight to underwriting and portfolio oversight
As catastrophe volatility intensifies in states like Florida, insurers are increasingly turning to property-level intelligence — including roof condition, parcel characteristics, and structural features — to better understand exposure and manage accumulation risk.
Southern Oak Insurance Company expanded its partnership with ZestyAI following nine months of portfolio impact using Z-PROPERTY™ to analyze structural condition across its Florida homeowners portfolio.
Lilypad-Centauri Insurance adopted Roof Age and Z-PROPERTY™ to improve visibility into roof replacement history, parcel characteristics, and structural exposure across its coastal homeowners and dwelling fire portfolios.
Click here to view the Southern Oak press release.
Click here to view the Lilypad-Centauri press release.
Industry Coverage
Read more from leading publications covering the P&C insurance industry:
PropertyCasualty360 — Who’s Using What in P&C Insurance
Insurance Edge — ZestyAI Wins Over More US Insurers
Insurance Innovation Reporter — Coastal Insurers Adopt ZestyAI Property-Level Intelligence for CAT Risk
Fintech Global — ZestyAI Grows Insurer Partnerships Amid Coastal Volatility
Insurtech Analyst — Coastal Insurers Expand ZestyAI Partnerships for Property Risk
.png)
Horace Mann Selects Full ZestyAI Risk and Decision Intelligence Platform
Educator-focused insurer adopts property-level AI insights to support underwriting decisions and operational efficiency
ZestyAI today announced that Horace Mann, the largest national insurer focusing on educators’ financial needs, has selected ZestyAI to support the modernization of its property underwriting operations.
Horace Mann will deploy Z-PROPERTY™, ZestyAI’s property intelligence platform that applies computer vision and machine learning across aerial imagery, building permit records, tax assessment data, and other verified sources to generate insights across more than 70 structural and parcel attributes for 150 million residential and commercial properties nationwide.
These property-level insights provide clearer visibility into condition and exposure, enabling underwriting teams to better differentiate risk across new business and renewals, streamline workflows, and reduce reliance on traditional inspection-heavy processes.
As part of its underwriting evolution, Horace Mann will leverage ZestyAI’s broader portfolio of property intelligence and peril-specific risk models—including Roof Age, Z-HAIL™, Z-WIND™, Z-STORM™, and Z-WATER™—to evaluate how advanced property intelligence can inform underwriting and rating decisions across weather- and non-weather risks over time.
“This partnership is about rethinking how underwriting decisions are made in a modern property market,” said Vanessa Jackson, SVP, Head of P&C at Horace Mann.
“By bringing scalable, property-level intelligence into our underwriting process, we’re positioning our teams to make faster, more informed decisions today, and to continuously adapt as risk and expectations evolve.”
“Horace Mann is taking a thoughtful, measured approach to underwriting modernization,” said Attila Toth, Founder and CEO of ZestyAI. “By adopting property-level intelligence, they are enhancing underwriting decisions today while building a strong foundation for continued operational improvement.”
"We are proud to support Horace Mann in their mission to provide educators with peace of mind, allowing them to focus on what matters most — shaping the next generation."
ZestyAI supported Horace Mann through a rigorous evaluation process, demonstrating how accurate, complete property-level insight delivered at scale can materially improve enterprise data quality, supporting more reliable underwriting and analytics across the portfolio.
Southern Oak Expands Use of ZestyAI After Nine Months of Proven Impact
Florida-based insurer broadens its use of ZestyAI as property-level intelligence becomes integral to portfolio management
ZestyAI today announced that Southern Oak Insurance Company has expanded its partnership with ZestyAI following nine months of demonstrated impact on portfolio decisions across its Florida homeowners portfolio.
Southern Oak initially adopted ZestyAI in 2025 to gain clearer visibility into property-level risk in one of the most complex and loss-prone insurance markets in the U.S.
Z-PROPERTY applies computer vision and machine learning across aerial imagery, building permits, tax assessment records, and other verified data sources to evaluate properties in 3D—assessing structural condition, exposure, and characteristics that influence claim frequency and severity across perils, including roof complexity, materials, and condition.
Tony Loughman, CEO of Southern Oak Insurance Company, said:
“Within months of deploying ZestyAI, it became clear that property-level intelligence needed to play a larger role in how we evaluate and manage risk. Expanding our partnership allows us to build on that foundation with greater confidence in the data behind our decisions, particularly in a market where roof condition, complexity, and exposure can materially impact outcomes.”
The expanded partnership reflects Southern Oak’s continued focus on proactive risk management in Florida’s volatile insurance environment, where traditional data sources often fail to capture the real condition and vulnerability of individual homes.
“Southern Oak’s decision to expand just nine months in is a strong signal of the value property-level intelligence delivers when it’s put into production,” said Attila Toth, Founder and CEO of ZestyAI.
“With Z-PROPERTY embedded in its risk decisions, Southern Oak sees risk more clearly, acts earlier, and makes more defensible decisions in a highly regulated, high-risk market.”
ZestyAI’s models are built with transparency, validation, and regulatory readiness at the forefront, giving insurers confidence to rely on them in portfolio decisions. The platform is used by leading insurers to improve underwriting accuracy, manage exposure, and reduce loss volatility across weather- and non-weather-driven perils.
Lilypad-Centauri Partners With ZestyAI to Strengthen Coastal Portfolio Using AI-Driven Risk Analytics
Lilypad-Centauri adopts roof and parcel-level insights to sharpen exposure data and strengthen risk decisions
ZestyAI today announced that Lilypad-Centauri is using ZestyAI’s Roof Age and Z-PROPERTY™ solutions to enhance its view of property risk across coastal homeowners and dwelling fire portfolios.
Lilypad-Centauri focuses on delivering stable and reliable coverage to homeowners and property owners in hurricane- and catastrophe-exposed coastal communities. By leveraging ZestyAI’s building attributes and parcel-level characteristics, Lilypad-Centauri gains a clearer view of property risk and how exposure accumulates across its coastal portfolio.
Lilypad-Centauri, through its managing general agency, is deploying two of ZestyAI’s proven solutions to gain a more granular, defensible view of property risk:
- Roof Age delivers verified roof age by cross-validating building permit records with over 20 years of aerial imagery, detecting roof replacement events, and assigning confidence scores across 97% of U.S. properties.
- Z-PROPERTY™ applies AI to high-resolution aerial imagery to assess roof complexity, materials, and condition, while evaluating parcel-level features such as vegetation overhang, yard debris, and secondary structures that influence claim frequency and severity across multiple perils.
“Coastal properties present a unique combination of exposure, from roof condition and construction features to how the parcel is maintained,” said Tony Hare, Chief Operating Officer & Chief Underwriting Officer of Lilypad-Centauri.
“ZestyAI’s roof and parcel-level analytics give us a clearer, property-level view of the homes we insure, helping us reduce uncertainty and better manage portfolio volatility.”
“Lilypad-Centauri is building a more resilient coastal portfolio by replacing exposure unknowns with verifiable property‑level truth,” said Attila Toth, Founder and CEO of ZestyAI.
“Granular, regulator-approved analytics bring confidence to the risk and capital decisions behind reliable customer protection.”
ZestyAI works closely with regulators to ensure transparency, validation, and continuous monitoring of its AI-driven models. Its portfolio of risk models has secured nearly 100 approvals from regulators nationwide, giving insurers confidence they can be deployed immediately with the accuracy and transparency regulators demand.
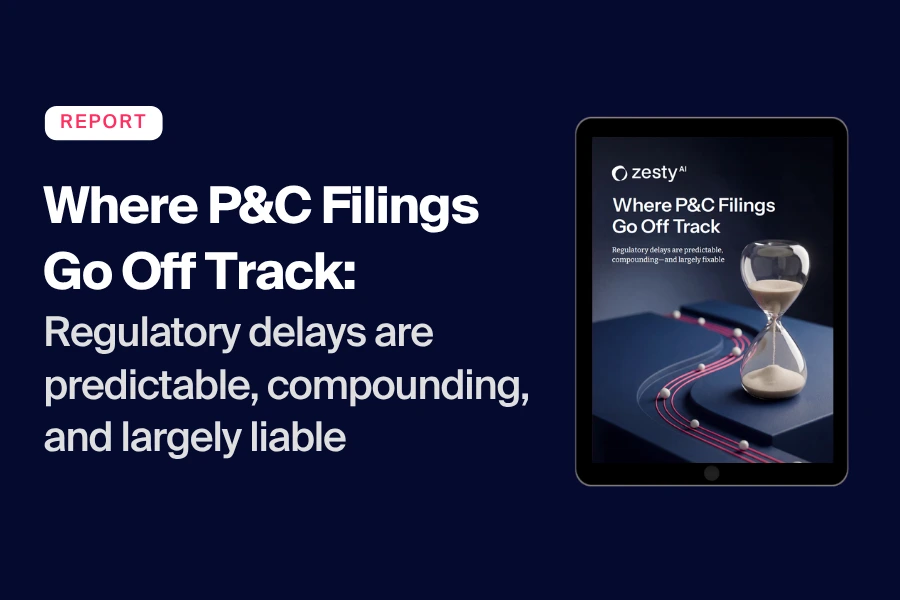
Where P&C Filings Go Off Track: The Execution Problem Behind Regulatory Delays
Regulatory delays in P&C filings are predictable, compounding, and largely fixable. A new ZestyAI research analysis of where filings actually break down shows the problem isn't primarily oversight — it's execution. Breakdowns cluster around a small number of recurring failure points, almost all of them early in the process, and once an objection cycle starts, delay compounds disproportionately with each round. The result is months of slippage that quietly erodes pricing effectiveness and consumes scarce actuarial and regulatory capacity.
About this analysis. Findings are drawn from analysis of recent P&C rate, rule, and form filings using ZORRO Discover, ZestyAI's AI agent purpose-built for insurance-specific research. The full report — Where P&C Filings Go Off Track — is an 8-page research analysis of filing breakdowns and the execution patterns that separate teams that manage delay from those that systematically reduce it.
Want the data? Download the full report →
Where do P&C filings actually go off track?
Not where most teams assume. Filings don't typically stall during deep technical review by regulators — they stall earlier, during submission, packaging, and initial support. Procedural gaps and missing exhibits trigger objections before reviewers ever engage with the substantive content of the filing. That's the first counterintuitive finding: a meaningful share of delay is generated before the regulator has even started evaluating the rate change, model factor, or rule update being filed.
The implication is that delay is largely an upstream problem with upstream fixes.
Why does delay compound once it starts?
Each objection round resets the review clock and expands the scope of scrutiny. What looks like a small clarification request adds weeks; a second cycle adds months; a third compounds further as the reviewer's questions broaden to adjacent assumptions. Once a filing is in the objection loop, timelines stretch disproportionately, not linearly. This is the second pattern: delay is non-linear, and most filing teams don't price the compounding cost of the second and third cycle into their internal timeline forecasts.
The carriers that move fastest are the ones that prevent the first objection — not the ones that respond to it well.
What does a late effective date actually cost?
The cost of delay is measurable, even when it's not always measured. Late effective dates scale impact in two directions at once: across the premium book affected by the change, and across the time the carrier operates under the prior (often inadequate) rates. A rate change that earns full approval three months late doesn't just lose three months of expected premium — it continues exposing the carrier to the loss patterns that motivated the change in the first place. Meanwhile, actuarial and regulatory teams burn cycles managing the objection process rather than building the next filing.
What do high-performing filing teams do differently?
They treat approval readiness as an operating capability, not a one-time deliverable. High-performing teams standardize how filings are packaged, build internal review against the procedural patterns regulators care about most, and use the institutional history of prior objections — their own and the market's — to anticipate the questions a reviewer will ask before the reviewer asks them. The performance gap between organizations isn't about regulatory environment or filing volume. It's about whether the filing function is built for speed.
What this means for 2026 product execution
As filings grow more complex and regulatory expectations rise, the gap is widening between organizations that manage delay and those that systematically reduce it. The pricing decisions, product changes, and risk responses being filed today only matter to the extent they reach the market when intended. Approval readiness is increasingly what separates carriers that translate strategy into results from those that watch their best work stall in the review queue.
Get the full report
Where P&C Filings Go Off Track →
The 8-page report walks through the specific breakdown patterns, where objection cycles start, how delay compounds across rounds, and how high-performing teams systematically reduce both.
Download the report — or request a trial of Zorro Discover to access the institutional filing history that lets teams anticipate regulator objections before they arrive.
ZestyAI Provides AI-Driven Risk Analytics for Marsh McLennan Agency
MMA’s Private Client Services division adopts wildfire, roof, and parcel-level insights to drive better outcomes for its high-net-worth clients
ZestyAI, the Risk and Decision Intelligence Platform for the insurance industry, today announced that Marsh McLennan Agency (MMA), a subsidiary of Marsh (NYSE: MRSH), has adopted its risk analytics
By leveraging three cutting-edge solutions from ZestyAI, Z-FIRE™, Roof Age, and Z-PROPERTY™, the MMA Private Client Services team was able to improve wildfire risk evaluation for these homeowners by analyzing detailed property data and loss history and assessing roof age and condition using high-resolution aerial imagery. This strategic deployment enhanced their ability to offer more precise, customized insurance and risk management solutions for their clients’ high-value homes.
“Safeguarding the lifestyles and legacies of our clients requires a forward-looking approach to risk,” said Robert Pritula, Senior Vice President, National Placement and Solutions Leader of MMA’s Private Client Services division.
“We are always looking for new ways to leverage cutting-edge technologies that will allow us to offer clients tailored and effective solutions to mitigate the threats facing their most valuable assets, including their homes.”
“MMA has built its reputation on exceptional client service and proactive risk management,” said Attila Toth, Founder and CEO of ZestyAI.
“With granular risk analytics backed by industry standards and proven accuracy, they are leading the way in how high-value portfolios can be protected with confidence.”
ZestyAI works closely with regulators to ensure transparency, validation, and continuous monitoring of its AI-driven models. Its portfolio of models has secured more than 80 approvals from regulators nationwide, including Z-FIRE™, which has been approved across every wildfire-prone state, giving insurers confidence they can be deployed immediately with the accuracy and transparency regulators demand.
Ready to see how ZestyAI works on your book of business?
Tell us a little about your needs. We'll show you how we reduce losses and help you price with precision.