Reports & Research
Explore proprietary research packed with data, insights, and real-world findings to help carriers make smarter decisions.

Wildfire Risk Across the Nation
We’ve created a visual guide to where wildfire risk is rising—and where opportunities for mitigation exist.
Wildfire Risk Is Rising Nationwide
Wildfire seasons are getting longer, more destructive, and harder to predict—and they’re no longer just a Western U.S. concern. From the Southeast to the Midwest, wildfire risk is emerging in places many insurers haven’t traditionally watched.
What the Latest Data Reveals About Wildfire Exposure
Drawing from the latest national datasets and insights from ZestyAI’s Z-FIRE™ model, this visual guide to wildfire risk in the U.S. shows:
- New wildfire hotspots: Discover where risk is rising fastest.
- Mitigation gaps: Learn how a lack of defensible space is putting thousands of homes in danger across the country.
- Top risk drivers: See how features like overhanging trees and wooden roofs are fueling destruction in high-risk areas.
BONUS: You’ll also get access to our latest online event with IBHS and Western Fire Chiefs Association, The LA Fires in Focus: What Worked, What Didn’t, What’s Next for Insurers.
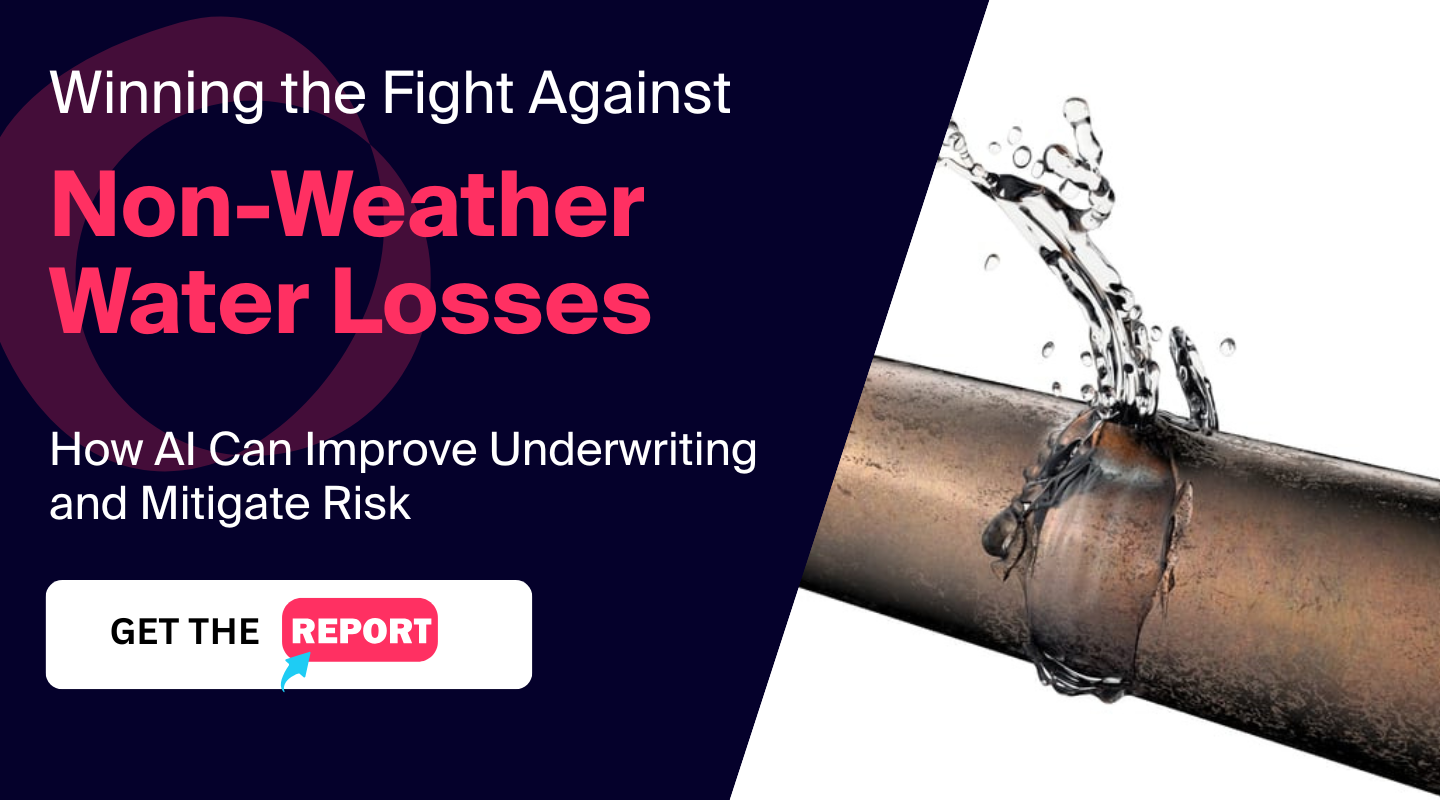
Why Non-Weather Water Losses Are Quietly Eroding Profitability
New research reveals how insurers can rethink their strategy for the 4th costliest peril in homeowners insurance
The Silent Peril Reshaping Homeowners Insurance
Non-weather water damage rarely makes headlines, but it’s quietly eroding profitability across the country.
It is now the fourth costliest peril in homeowners insurance, and claim severity has increased 80% in the last decade—a trend that’s accelerating even as frequency remains relatively flat.
Traditional risk models struggle to capture the early warning signs behind these losses, leading to mispriced policies, undetected exposure, and rising volatility for carriers.
Want the full analysis? Download the complete “Winning the Fight Against Non-Weather Water Losses” guide.
Why Loss Severity Keeps Rising
Aging homes and overlooked system failures
Many of the most expensive losses stem from aging plumbing, deteriorating materials, and slow-burn failures that often go undetected until damage is significant.
Frequency is flat—severity is not
Loss patterns suggest that while the number of events hasn’t surged, the financial impact of each event has—a signal that traditional models are not capturing the right property-level predictors.
The Property Features Most Predictive of Water Losses
The overlooked attributes that traditional models miss
Standard territory- or age-based assessments often ignore the property-specific details that meaningfully influence water loss risk, including:
- supply line material and age
- plumbing configuration
- occupancy patterns
- system maintenance and upgrades
- moisture exposure and prior loss indicators
These factors vary widely between neighboring homes—yet most models treat them as identical.
Where Traditional Underwriting Falls Short
ZIP-code and age-based proxies mask true risk
Legacy approaches rely heavily on broad territory-level assumptions that overlook structural vulnerabilities and system conditions.
Limited visibility creates mispriced policies
Without property-level insight, high-risk homes are often underpriced while lower-risk homes subsidize them—driving loss ratio volatility over time.
Get deeper insights on the drivers of water loss severity in our full guide → “Winning the Fight Against Non-Weather Water Losses”
How AI and Property-Level Data Are Changing the Landscape
AI models trained on real-world claims data can identify early signals of potential water loss by analyzing the interaction between:
- plumbing systems
- property attributes
- historical patterns
- material degradation
- repair history
This enables carriers to segment risk accurately, adjust pricing, and reduce preventable losses—long before small issues turn into major claims.
What Homeowners Actually Understand About Water Risk
Misconceptions around coverage and prevention
ZestyAI’s research shows that many policyholders:
- misunderstand what is and isn’t covered
- underestimate how much damage water can cause
- rarely take preventive actions unless prompted
This disconnect creates an opportunity for carriers to strengthen education, mitigation, and customer engagement.
Steps Carriers Can Take Today
Improve segmentation and rating accuracy
Property-level signals enable more precise risk tiers and more stable long-term portfolios.
Strengthen mitigation and reduce loss severity
Insights help identify which homes are at elevated risk and where targeted mitigation can reduce exposure.
Enhance underwriting workflows with explainable insights
Transparent, explainable AI helps underwriters understand the key drivers behind elevated risk—supporting both decision-making and regulatory review.
Get the Full Guide
Our new research paper, Winning the Fight Against Non-Weather Water Losses, breaks down the trends reshaping this growing peril—and the strategies carriers can use to get ahead of it.
Access the Guide
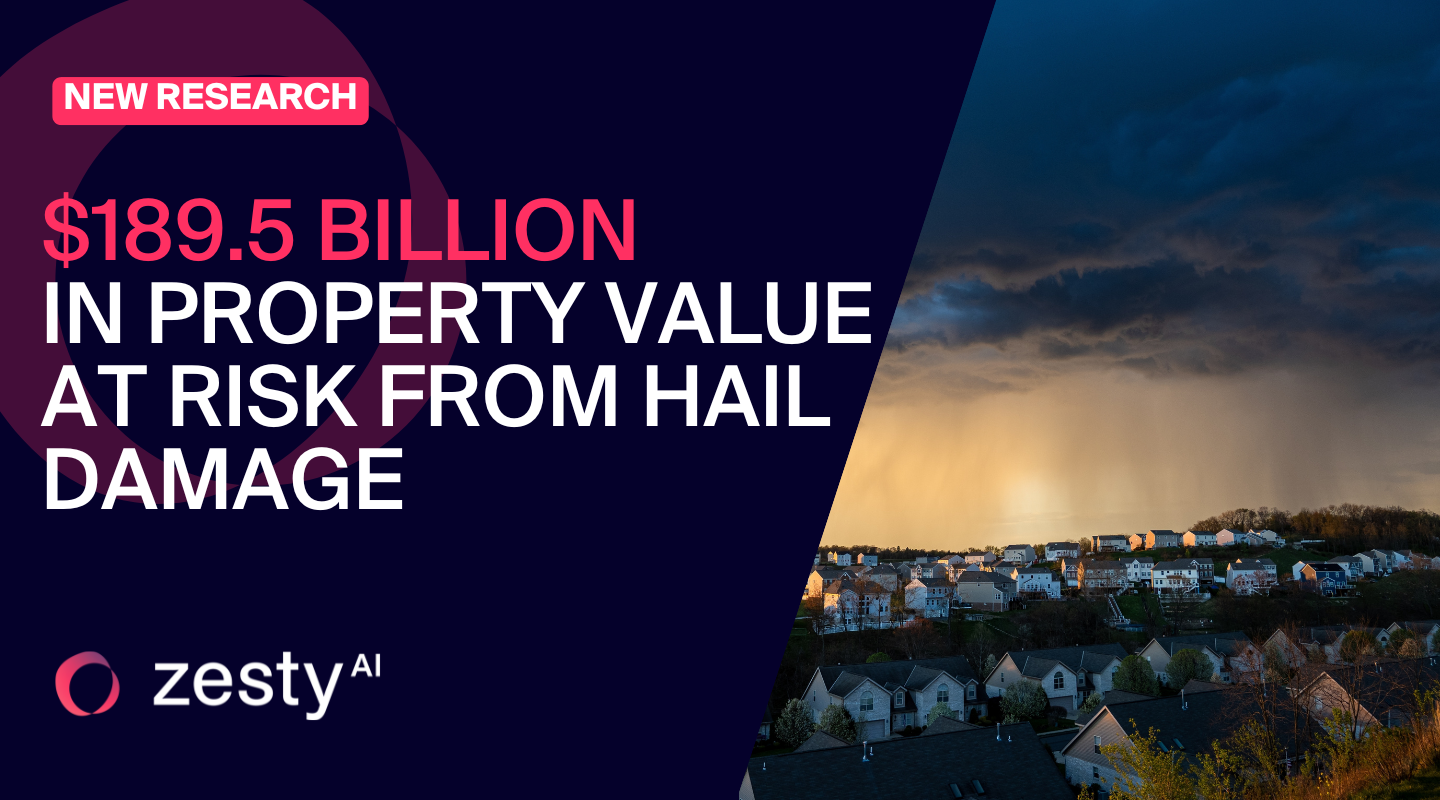
12.6 million US properties at high risk from hail damage
ZestyAI analysis reveals $189.5 billion in potential hail losses.
ZestyAI's analysis revealed that more than 12.6 million U.S. properties are at high risk of hail-related roof damage, representing $189.5 billion in potential replacement costs.
Powered by ZestyAI’s Z-HAIL™ model, the analysis underscores the growing financial threat of severe convective storms (SCS), including hail, tornadoes, and wind events. In 2024 alone, damages from SCS were estimated at $56 billion—surpassing losses from hurricanes.
Yet many insurers still rely on traditional models designed to estimate portfolio-level exposure, not property-level risk. As hail events increase in severity and frequency, these models often miss the structural and environmental conditions that drive real losses.
Kumar Dhuvur, Co-Founder and Chief Product Officer at ZestyAI said:
“Catastrophe models have helped insurers understand where storms may strike and how losses might add up at a portfolio level. But they weren’t built to assess risk at the individual property level, and they often miss the specific conditions that drive hail damage. By analyzing the interaction between structure-specific features and local storm patterns, we can distinguish risk between neighboring properties—enabling smarter underwriting, more precise pricing, and better protection for policyholders.”
Z-HAIL evaluates hail risk using a proprietary blend of climate, aerial, and property-specific data. By applying advanced machine learning to these inputs, Z-HAIL delivers highly granular predictions that reflect both the physical characteristics of a structure and the storm activity in its immediate surroundings.
Key findings from the analysis:
- 12.6 million U.S. structures flagged as high risk for hail-related roof damage
- $189.5 billion in total potential roof replacement exposure
Top five states by dollar exposure:
- Texas ($68B)
- Colorado ($16.7B)
- Illinois ($10.8B)
- North Carolina ($10.4B)
- Missouri ($9.5B)
States with the lowest dollar exposure:
- Maine ($4.7M)
- Idaho ($12.8M)
- New Hampshire ($18.5M)
- Nevada ($49.3M)
- Vermont ($64.7M)
In recent case studies, Z-HAIL has demonstrated the ability to pinpoint which properties are most susceptible to hail damage—even within the same neighborhood and exposed to the same storm. In one example from Allen, Texas, following a storm with 2.5-inch hailstones, Z-HAIL segmented risk across 483 policies, identifying no losses among properties rated “Very Low” by the model. This level of intra-territory precision gives insurers the ability to refine risk selection with confidence—even in the most hail-prone regions of the country.
.png)
2025 Storm Risk Webinar Now Available On Demand
Stream our webinar for a preview of severe convective storm risk in 2025 and see how AI-driven insights can help you stay prepared.
Severe convective storms are becoming more frequent and costly, putting pressure on insurers to refine underwriting and risk management strategies.
On April 2, our experts covered:
- Key drivers behind increasing severe storm losses
- What La Niña means for the 2025 season
- How AI-powered risk models improve risk segmentation
- Live Q&A – Get expert answers to your toughest questions!
Missed the live event? Stream now!

Report: Severe Convective Storm Preview 2025
Get the insights to manage risk in 2025 before claims surge.
Severe convective storms (SCS)—including tornadoes, hail, and damaging wind events—resulted in $58 billion in insured losses across the U.S in 2024.
Insurers face a dual challenge: navigating the uncertainty of storm patterns while ensuring their portfolios remain resilient enough to absorb the financial strain from clustered, high-loss events.
Research with IBHS confirms that SCS damage accumulates over time, particularly affecting rooftops after multiple exposures to intense storm activity. As housing stock deteriorates, insurers must reassess their portfolios to ensure underwriting, rating, and loss cost controls align with their risk appetite and maintain premiums that accurately reflect evolving exposure.
Get ahead of rising storm risks with expert insights that help you strengthen underwriting, risk assessment, and claims management.
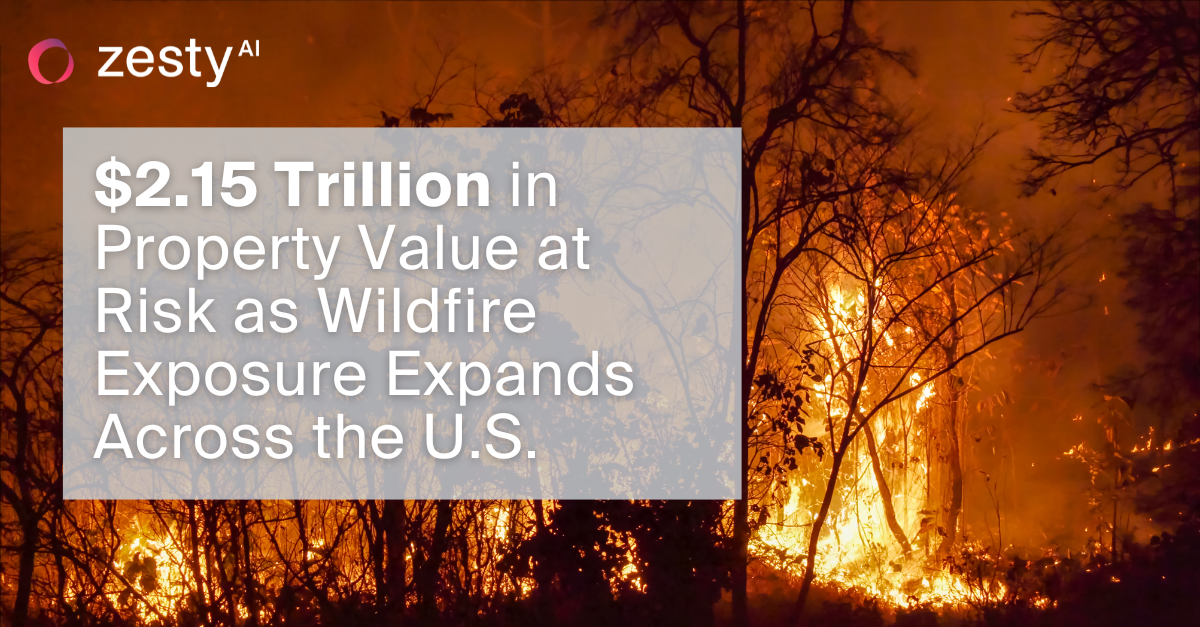
$2.15 Trillion in Property Value at Risk as Wildfire Exposure Expands Across the U.S.
ZestyAI Identifies 4.3 Million U.S. Homes with High Wildfire Risk.
A staggering $2.15 trillion worth of U.S. residential property is at high risk of wildfire damage, according to a new AI-powered analysis from ZestyAI, the leader in climate and property risk analytics. The study, which assessed 126 million properties nationwide, found that 4.3 million individual homes face heightened wildfire risk—far beyond traditionally recognized high-risk areas.
Using advanced AI models trained on over 2,000 historical wildfires, ZestyAI mapped wildfire exposure at the property level, integrating satellite and aerial imagery, topography, and structure-specific characteristics. While California leads the nation with $1.16 trillion in wildfire-exposed property, other states such as Colorado ($190.5 billion), Utah ($100.3 billion), and North Carolina ($71.2 billion) also face significant risk.
Wildfire Risk is a Nationwide Challenge
While the Western U.S. has historically seen the most severe wildfire activity, ZestyAI’s findings confirm that high-risk properties exist across the country. States like North Carolina (4.6% of homes at high risk), Kentucky (2.9%), Tennessee (2.3%), and even South Dakota (11.0%) are now seeing increased wildfire exposure.
As more homes and businesses are built in fire-prone landscapes, the Wildland-Urban Interface (WUI) continues to expand. This, combined with intensifying climate conditions, is driving higher insurance costs and growing availability concerns. Today, one in eight U.S. homeowners already lacks adequate insurance coverage, and that number is expected to rise.
AI Expands Insurance Access in High-Risk Areas
Attila Toth, Founder and CEO of ZestyAI said:
"Wildfires are threatening more properties than ever before, with billions of dollars in exposure even in areas many people don’t associate with fire risk. Yet, too many homeowners are finding themselves uninsured or underinsured just as these disasters become more frequent and severe. Insurers have traditionally relied on broad, regional models that don’t account for individual property characteristics."
"That means some homeowners are denied coverage even when their true risk is much lower than their neighbors'.’"
AI-driven risk analytics are reshaping the way insurers assess wildfire exposure. By providing granular, property-specific insights, we’re helping insurers make smarter underwriting decisions—keeping coverage available in high-risk areas while ensuring that homeowners who take mitigation steps are recognized.
Last year, our models helped insurers extend coverage to 511,000 properties that had previously struggled to secure insurance due to outdated risk models. In 2025, we expect that number to reach a million, ensuring that even in high-risk areas, responsible homeowners have access to protection when disaster strikes.
.png)
Now Streaming: The Hidden Redesign of P&C Insurance
What 2 Million Filings Reveal About 2026 Product Strategy
P&C Insurance Is Being Rewritten - Quietly but Rapidly.
Filings from the last three years show faster shifts in P&C products than at any point in recent history - and those changes are now surfacing at scale.
Endorsements, exclusions, deductibles, and appetite resets are reshaping coverage and competitive positioning across carriers. But the pace isn't uniform. National carriers, regionals, MGAs, and farm bureaus are moving in different directions - and most teams don't have visibility into how quickly competitors are adjusting forms and filings.
This session breaks down the signals that matter for 2026 product strategy.
Drawing on 2M+ carrier filings, Stephanie Kuczynski reveals the real trends reshaping P&C product strategy headed into 2026.
You'll learn what's accelerating, where carriers diverge, and how to translate these shifts into action.
What You Will Gain
- Which changes are accelerating fastest — and where carriers diverge. State-by-state adoption patterns for endorsements, deductibles, and coverage restrictions.
- How strategies differ by carrier size and focus — niche players vs. nationals. The creative, targeted approaches emerging from regionals and MGAs versus the broad strategies deployed by national carriers.
- Where regulators are drawing the line on coverage restrictions. Prepare for closer state-level inspection, due diligence, and shifting expectations across markets.
- How these shifts impact 2026 product strategy and competitive positioning. Why the pace and direction of changes matter — and how to ensure your strategy reflects where the market is heading.
Watch Now
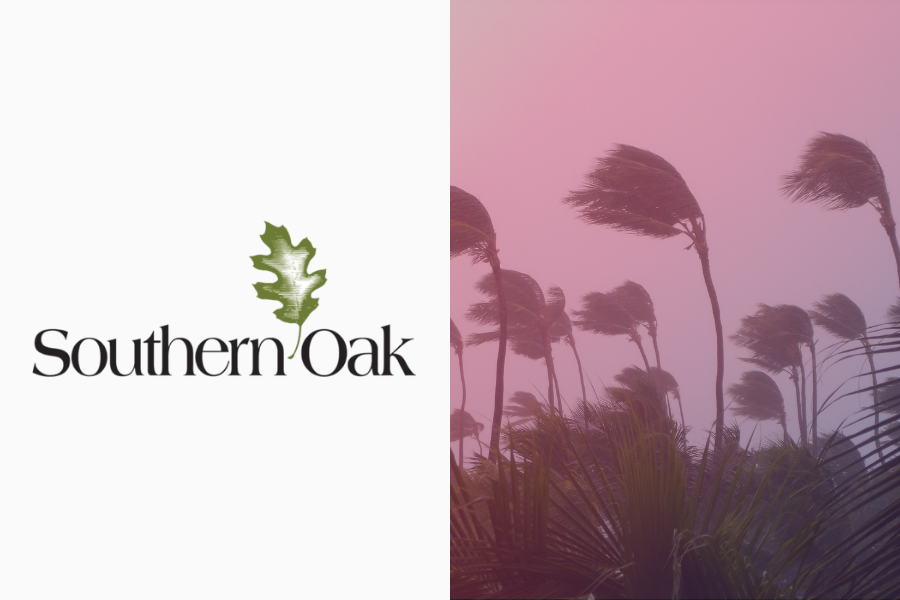
Southern Oak Expands Use of ZestyAI After Nine Months of Proven Impact
Florida-based insurer broadens its use of ZestyAI as property-level intelligence becomes integral to portfolio management
ZestyAI today announced that Southern Oak Insurance Company has expanded its partnership with ZestyAI following nine months of demonstrated impact on portfolio decisions across its Florida homeowners portfolio.
Southern Oak initially adopted ZestyAI in 2025 to gain clearer visibility into property-level risk in one of the most complex and loss-prone insurance markets in the U.S.
Z-PROPERTY applies computer vision and machine learning across aerial imagery, building permits, tax assessment records, and other verified data sources to evaluate properties in 3D—assessing structural condition, exposure, and characteristics that influence claim frequency and severity across perils, including roof complexity, materials, and condition.
Tony Loughman, CEO of Southern Oak Insurance Company, said:
“Within months of deploying ZestyAI, it became clear that property-level intelligence needed to play a larger role in how we evaluate and manage risk. Expanding our partnership allows us to build on that foundation with greater confidence in the data behind our decisions, particularly in a market where roof condition, complexity, and exposure can materially impact outcomes.”
The expanded partnership reflects Southern Oak’s continued focus on proactive risk management in Florida’s volatile insurance environment, where traditional data sources often fail to capture the real condition and vulnerability of individual homes.
“Southern Oak’s decision to expand just nine months in is a strong signal of the value property-level intelligence delivers when it’s put into production,” said Attila Toth, Founder and CEO of ZestyAI.
“With Z-PROPERTY embedded in its risk decisions, Southern Oak sees risk more clearly, acts earlier, and makes more defensible decisions in a highly regulated, high-risk market.”
ZestyAI’s models are built with transparency, validation, and regulatory readiness at the forefront, giving insurers confidence to rely on them in portfolio decisions. The platform is used by leading insurers to improve underwriting accuracy, manage exposure, and reduce loss volatility across weather- and non-weather-driven perils.
Lilypad-Centauri Partners With ZestyAI to Strengthen Coastal Portfolio Using AI-Driven Risk Analytics
Lilypad-Centauri adopts roof and parcel-level insights to sharpen exposure data and strengthen risk decisions
ZestyAI today announced that Lilypad-Centauri is using ZestyAI’s Roof Age and Z-PROPERTY™ solutions to enhance its view of property risk across coastal homeowners and dwelling fire portfolios.
Lilypad-Centauri focuses on delivering stable and reliable coverage to homeowners and property owners in hurricane- and catastrophe-exposed coastal communities. By leveraging ZestyAI’s building attributes and parcel-level characteristics, Lilypad-Centauri gains a clearer view of property risk and how exposure accumulates across its coastal portfolio.
Lilypad-Centauri, through its managing general agency, is deploying two of ZestyAI’s proven solutions to gain a more granular, defensible view of property risk:
- Roof Age delivers verified roof age by cross-validating building permit records with over 20 years of aerial imagery, detecting roof replacement events, and assigning confidence scores across 97% of U.S. properties.
- Z-PROPERTY™ applies AI to high-resolution aerial imagery to assess roof complexity, materials, and condition, while evaluating parcel-level features such as vegetation overhang, yard debris, and secondary structures that influence claim frequency and severity across multiple perils.
“Coastal properties present a unique combination of exposure, from roof condition and construction features to how the parcel is maintained,” said Tony Hare, Chief Operating Officer & Chief Underwriting Officer of Lilypad-Centauri.
“ZestyAI’s roof and parcel-level analytics give us a clearer, property-level view of the homes we insure, helping us reduce uncertainty and better manage portfolio volatility.”
“Lilypad-Centauri is building a more resilient coastal portfolio by replacing exposure unknowns with verifiable property‑level truth,” said Attila Toth, Founder and CEO of ZestyAI.
“Granular, regulator-approved analytics bring confidence to the risk and capital decisions behind reliable customer protection.”
ZestyAI works closely with regulators to ensure transparency, validation, and continuous monitoring of its AI-driven models. Its portfolio of risk models has secured nearly 100 approvals from regulators nationwide, giving insurers confidence they can be deployed immediately with the accuracy and transparency regulators demand.
ZestyAI Provides AI-Driven Risk Analytics for Marsh McLennan Agency
MMA’s Private Client Services division adopts wildfire, roof, and parcel-level insights to drive better outcomes for its high-net-worth clients
ZestyAI, the Risk and Decision Intelligence Platform for the insurance industry, today announced that Marsh McLennan Agency (MMA), a subsidiary of Marsh (NYSE: MRSH), has adopted its risk analytics
By leveraging three cutting-edge solutions from ZestyAI, Z-FIRE™, Roof Age, and Z-PROPERTY™, the MMA Private Client Services team was able to improve wildfire risk evaluation for these homeowners by analyzing detailed property data and loss history and assessing roof age and condition using high-resolution aerial imagery. This strategic deployment enhanced their ability to offer more precise, customized insurance and risk management solutions for their clients’ high-value homes.
“Safeguarding the lifestyles and legacies of our clients requires a forward-looking approach to risk,” said Robert Pritula, Senior Vice President, National Placement and Solutions Leader of MMA’s Private Client Services division.
“We are always looking for new ways to leverage cutting-edge technologies that will allow us to offer clients tailored and effective solutions to mitigate the threats facing their most valuable assets, including their homes.”
“MMA has built its reputation on exceptional client service and proactive risk management,” said Attila Toth, Founder and CEO of ZestyAI.
“With granular risk analytics backed by industry standards and proven accuracy, they are leading the way in how high-value portfolios can be protected with confidence.”
ZestyAI works closely with regulators to ensure transparency, validation, and continuous monitoring of its AI-driven models. Its portfolio of models has secured more than 80 approvals from regulators nationwide, including Z-FIRE™, which has been approved across every wildfire-prone state, giving insurers confidence they can be deployed immediately with the accuracy and transparency regulators demand.

What Winter Storm Fern Reveals about Interior Water Losses and Systemic Risk
ZestyAI Product Insights
Winter Storm Fern has evolved into a historic catastrophe for the U.S. insurance industry. Between January 23-27, 2026, the storm shattered records by placing over 230 million Americans under severe winter alerts, with a death toll of 85 as of February 3rd.
Preliminary industry estimates place insured losses at $6.7 billion, potentially making Fern the third-costliest U.S. winter storm on record, trailing Elliott (2022) and Uri (2021). The crisis is far from over. The National Weather Service warns of a "historic duration" of extreme cold, with temperatures 15 to 25 degrees below average, that continues to hamper mitigation efforts.
For carriers, Fern is a complex, multi-peril challenge. Claims teams are navigating a surge of freeze-related losses, ice-driven structural damage, and widespread business interruptions across 34 states.
To understand the stakes, one needs to look no further than February 2021, when Winter Storm Uri brought Texas to its knees and generated over $11 billion in insured losses from a single state. Fern’s footprint is broader, and its secondary effects are still unfolding.
The Cold Hard Numbers from Storm Uri: Why Claims Explode Below 5°F
Our analysis of the 2021 Storm Uri reveals a striking relationship between temperature deviation and claim frequency for the non-weather water and freeze perils. Using data from multiple carriers, we tracked daily claim rates against minimum temperatures: before, during, and after the storm window (February 11-20, 2021).
The results show how rapidly falling temperatures can transform a routine winter pattern into a systemic loss event, allowing us to monitor the market’s response in real-time as conditions deteriorated, peaked, and normalized.
The results are dramatic:
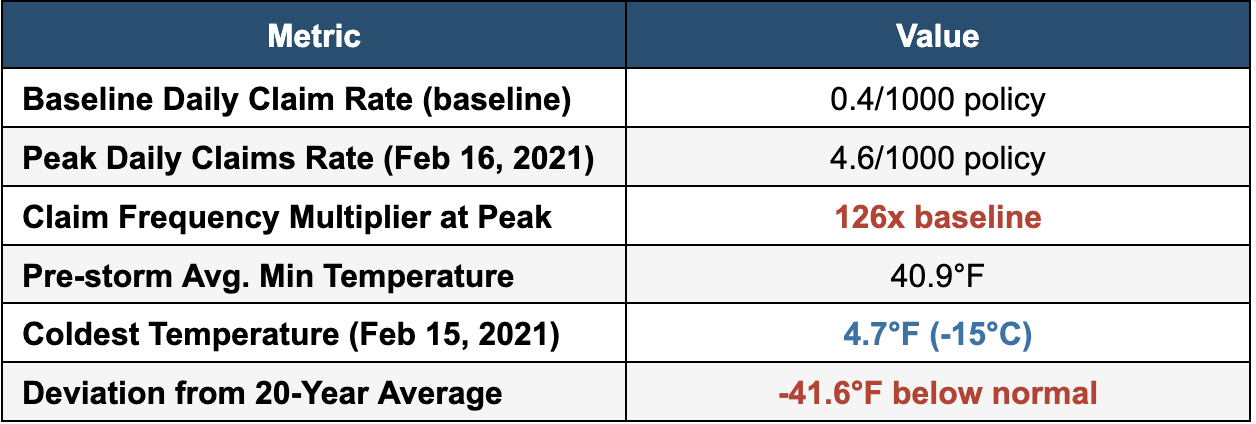
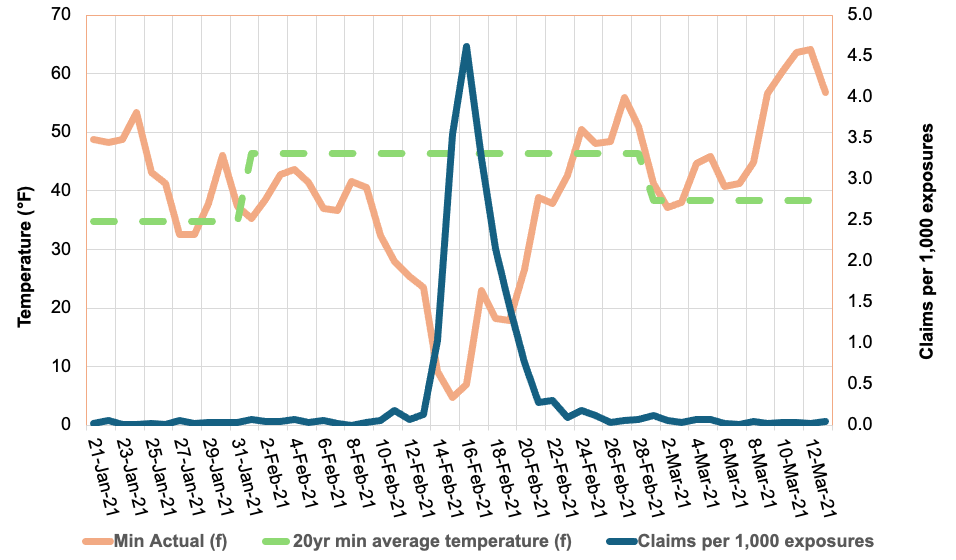
Figure 1: Daily claim rates (blue line) surged 126X above the baseline in a temporal spike as temperatures (orange line) plunged below the 20-year average (dashed green line) during Winter Storm Uri.
The chart reveals a clear inverse relationship: as minimum temperatures dropped from the mid-40s°F to below 5°F, daily claim rates didn’t just rise, they increased 126X, from a baseline of 0.04% to 0.46% at the peak. This dramatic surge underscores the significant consequences of extreme cold events on insurance liability.
Figure 2: ZestyAI’s Z-WATER™ demonstrated an 11X increase in claim frequency between ‘Very High’ and ‘Very Low’ risk tiers during Winter Storm Uri
We used ZestyAI’s Z-WATER™ to segment the property-specific non-weather water risk across the 10-day storm window. Z-WATER™ is a risk model that accounts for how plumbing design, local climate, and infrastructure reliability interact to drive non-weather water and freeze losses. By capturing real-world dynamics, such as temperature swings that stress pipes and electrical grid failures that amplify claims, the model delivers a scientifically grounded view of property-level risk.
The results were definitive: properties that Z-WATER™ scored as ‘Very High’ risk filed 26 claims per 1,000, compared to just 2.2 claims per 1,000 for those scored as ‘Very Low’, an 11X increase in claim frequency.
This accurate segmentation reveals a clear path to managing volatility. Z-WATER™ provides a deep understanding of a home’s resilience across the full spectrum of loss mechanisms, from everyday plumbing failures to expensive outlier events like Storms Uri and Fern. By enabling precise intra-territory risk splitting, the model allows carriers to price and underwrite more reliably, ensuring premiums reflect the true risk profile while protecting the portfolio against systemic losses.
The January 2026 Storm: History Rhyming?
While we can already see the immediate impact of Winter Storm Fern, the primary difference between Fern and Winter Storm Uri is the duration of the freezing event itself, rather than any changes in how quickly policyholders are filing their claims.
As shown in Figure 1, NWW claims rise rapidly as temperatures fall and taper off quickly once conditions normalize. The risk in prolonged cold events lies in how long properties stay below the Plumbing Design Temperature; the longer the freeze, the greater the likelihood of systemic plumbing failure.
During Winter Storm Uri, extended sub-freezing conditions significantly increased the number of days in which vulnerable properties were exposed to frozen pipe failures, driving aggregate losses to historic levels. Fern is now exhibiting a similar duration profile, with sub-freezing conditions persisting for up to 10 consecutive days across parts of the Northeast. The National Weather Service has warned this “could be the longest duration of cold in several decades,” raising the likelihood of elevated losses even if individual claims remain tightly clustered in time.
For carriers, the warning signs are already flashing:
- The Power Failure Multiplier: During the storm's peak, over 1 million customers lost power. In the South, where homes lack the heavy thermal insulation of northern properties, a power outage is the primary driver of catastrophic pipe bursts. Without active heating, a property can reach the "burst threshold" within hours.
- The $30,000 Claim Severity Benchmark: Recent State Farm data underscores the high stakes of these events. Winter water damage claims totaled over $628 million, with the average claim payment now exceeding $30,000. For carriers, this high per-claim severity means even a moderate frequency surge can quickly erode Q1 margins.
- Regional Fragility in the South: While the initial assessments are still surfacing, early industry estimates for privately insured losses from Winter Storm Fern puts the damage at $4 billion to $7 billion. With Texas and Tennessee identified as the hardest-hit states, carriers are facing a "Uri-style" scenario in which infrastructure wasn't designed for a 10-day deep freeze.
From Reactive to Predictive: Solving the $6.7 Billion Freeze Risk Equation
The 2021 Texas freeze taught us that traditional approaches to freeze risk are highly insufficient. Many properties that experienced burst pipes were in areas that rarely see extended freezing temperatures, meaning they lacked adequate winterization.
This is where predictive analytics becomes essential. By modelling the interaction between property-level vulnerabilities and local temperature thresholds, carriers can better identify which properties are most vulnerable to freeze events before the damage actually occurs.
Key Risk Drivers Identified in Our Latest Analysis:
- The Design Mismatch: The greatest risk isn't just the cold; it's the sudden change in temperature. Properties in states like Texas or Tennessee face a higher risk because they are built to release heat, not trap it. They lack the heavy insulation and deep-buried pipes needed to survive a 10-day freeze.
- The Power Grid Vulnerability: Our analysis shows that areas prone to power outages face a compounded risk. In the South, a home’s primary defense is its heating system so when the power fails and the heater stops, the "burst threshold" can be reached in just a few hours.
- Building Vulnerabilities: Our analysis shows that older homes and properties with plumbing routed through exterior walls are disproportionately represented among $30,000 non-weather water losses.
The Bottom Line for Carriers
The 2021 Texas freeze was a pivotal moment for the industry, generating more than 500,000 claims and $11.2 billion in insured losses in a single state. Today, Winter Storm Fern represents an even broader systemic threat, with weather alerts impacting 230 million people across more than 30 states.
While the final tally for Fern is still developing, the data is already clear: temperature shocks drive claims at exponential rates. With early industry assessments estimating privately insured losses between $4 billion and $7 billion, it is evident that the prolonged duration and geographic anomaly of extreme weather events are the primary drivers of this volatility.
For carriers looking to protect their Q1 margins, predictive analytics are no longer a luxury; they are a requirement. By analyzing property-level characteristics, regional vulnerabilities, and historical temperature deviations, you can move from reactive claims handling to proactive risk management.
The question isn't whether another major freeze will occur, but whether your portfolio is prepared for the next 126-fold surge.
Learn More About Z-WATER
ZestyAI’s Z-WATER™ provides the industry’s most granular view of interior water risk, helping carriers accurately and reliably assess properties in areas prone to temperature shock events. By analyzing detailed property-level characteristics alongside historical weather patterns and regional risk factors, our advanced models predict the likelihood of Non-Weather Water (NWW) and freeze claims as well as their associated severity. This deeper level of analysis empowers carriers to make smarter pricing decisions before the next major storm hits.
Methodology: Analysis based on aggregated claims from multiple Texas carriers during Winter Storm Uri (February 2021). Temperature data reflects mean daily minimums across the exposure footprint, weighted by ZIP Code to account for geographic density. The claim/exposure ratio was calculated by dividing daily claims by the average policy-day exposure.
-----------------------------------------------------------------
1CNN Weather, "More than 230 million people under alerts for potential ice, heavy snow and extreme cold," January 2026. [link]
2Fox News, "Noem coordinates with Mississippi officials as state recovers from deadly winter storm," January 2026. [link]
3Insurance Innovation Reporter, “KCC Estimates $6.7 Billion in Insured Losses from Winter Storm Fern,“ February 2026 [link]
4Texas Department of Insurance, "Insured Losses Resulting from the February 2021 Texas Winter Weather Event," March 2022. [link]
5Fox Business, “More than 1 million Americans lose power as monster winter storm sweeps across the US,” January 2025 [link]
6Carrier Management, “Frozen Pipes Lead to $628M in Losses for State Farm,” January, 2026 [link]
7 Barrons, “Winter Storm Fern Packed a Wallop. Now the Cost Estimates Are Rolling In.,“ February 2026 [link]
Logic Underwriters Adopts ZestyAI to Strengthen Texas Property Underwriting with AI-Powered Hail and Wind Models
Storm and property insights help inform risk-aligned coverage decisions
ZestyAI today announced that Logic Underwriters has adopted ZestyAI’s Z-PROPERTY™, Z-HAIL™, and Z-WIND™ solutions to improve underwriting and rating precision across its personal and commercial property portfolio in Texas.
Texas is the most expensive severe convective storm market in the United States, with hail and damaging wind driving billions of dollars in insured losses every year.
"Texas is one of the most challenging storm markets in the U.S., and we need tools that match that reality," said Bill Motz, Director of Operations, Logic Underwriters.
"ZestyAI's detailed property insights and dedicated hail and wind models will help us continue to provide exemplary service to our clients—from more accurate risk assessments to better loss prevention guidance in increasingly volatile weather conditions."
ZestyAI’s property-specific hail and wind models predict the likelihood and severity of storm-driven claims by analyzing how local climatology interacts with detailed property characteristics—helping underwriters to distinguish meaningful differences in risk within the same rating territory. Each model is trained on validated claims data, offering transparent explanations of the key factors driving risk.
Z-PROPERTY applies AI to high-resolution aerial imagery and multi-source data to assess roof condition, structural complexity, and parcel-level features such as vegetation overhang, yard debris, and secondary structures—factors that directly influence claim frequency and severity across multiple perils.
“Logic Underwriters is exactly the kind of forward-looking partner that is redefining underwriting in high-exposure states,” said Attila Toth, Founder and CEO of ZestyAI.
"This collaboration shows how property-level intelligence can support underwriting excellence and disciplined decision-making while helping policyholders better understand and protect their properties. When insurers can identify specific risk factors like roof condition or vegetation overhang, they can provide actionable guidance that helps clients reduce their exposure and minimize losses."
ZestyAI’s severe convective storm models are approved in 30 states, spanning the nation’s highest-exposure hail and wind markets, and used by leading insurers across the country.
See How Insights Turn Into Decisions
ZestyAI transforms data into action. Get a demo to see how the same AI powering our reports helps carriers make faster, smarter, regulator-ready decisions.