Reports & Research
Explore proprietary research packed with data, insights, and real-world findings to help carriers make smarter decisions.
.png)

What Winter Storm Fern Reveals about Interior Water Losses and Systemic Risk
ZestyAI Product Insights
Winter Storm Fern has evolved into a historic catastrophe for the U.S. insurance industry. Between January 23-27, 2026, the storm shattered records by placing over 230 million Americans under severe winter alerts, with a death toll of 85 as of February 3rd.
Preliminary industry estimates place insured losses at $6.7 billion, potentially making Fern the third-costliest U.S. winter storm on record, trailing Elliott (2022) and Uri (2021). The crisis is far from over. The National Weather Service warns of a "historic duration" of extreme cold, with temperatures 15 to 25 degrees below average, that continues to hamper mitigation efforts.
For carriers, Fern is a complex, multi-peril challenge. Claims teams are navigating a surge of freeze-related losses, ice-driven structural damage, and widespread business interruptions across 34 states.
To understand the stakes, one needs to look no further than February 2021, when Winter Storm Uri brought Texas to its knees and generated over $11 billion in insured losses from a single state. Fern’s footprint is broader, and its secondary effects are still unfolding.
The Cold Hard Numbers from Storm Uri: Why Claims Explode Below 5°F
Our analysis of the 2021 Storm Uri reveals a striking relationship between temperature deviation and claim frequency for the non-weather water and freeze perils. Using data from multiple carriers, we tracked daily claim rates against minimum temperatures: before, during, and after the storm window (February 11-20, 2021).
The results show how rapidly falling temperatures can transform a routine winter pattern into a systemic loss event, allowing us to monitor the market’s response in real-time as conditions deteriorated, peaked, and normalized.
The results are dramatic:
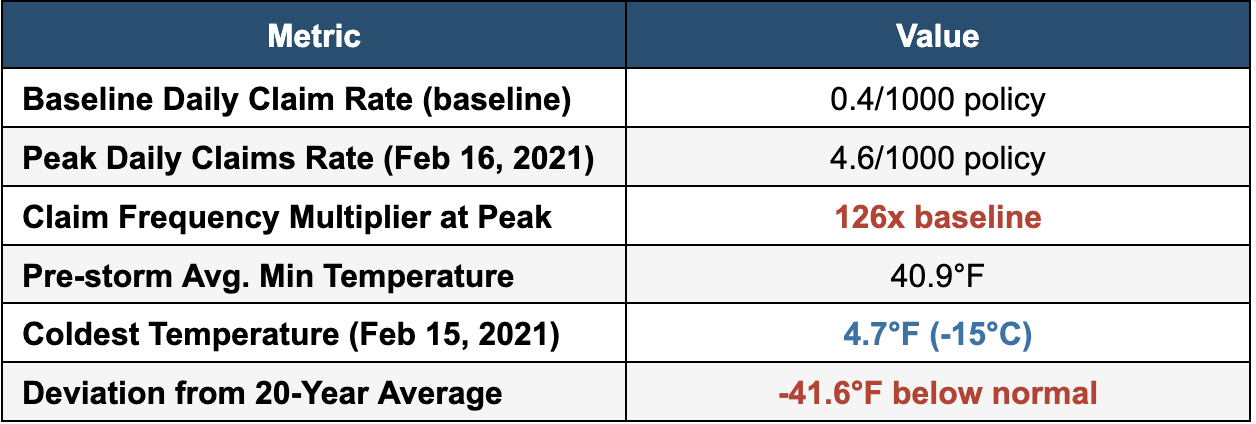
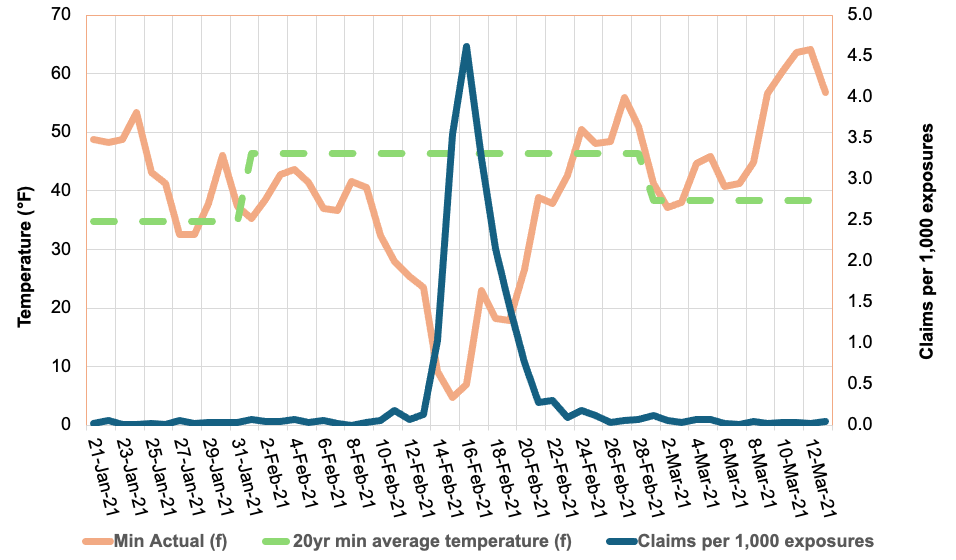
Figure 1: Daily claim rates (blue line) surged 126X above the baseline in a temporal spike as temperatures (orange line) plunged below the 20-year average (dashed green line) during Winter Storm Uri.
The chart reveals a clear inverse relationship: as minimum temperatures dropped from the mid-40s°F to below 5°F, daily claim rates didn’t just rise, they increased 126X, from a baseline of 0.04% to 0.46% at the peak. This dramatic surge underscores the significant consequences of extreme cold events on insurance liability.
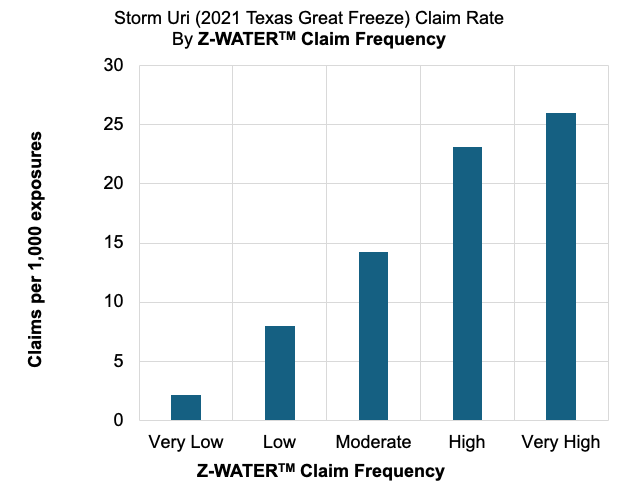
Figure 2: ZestyAI’s Z-WATER™ demonstrated an 11X increase in claim frequency between ‘Very High’ and ‘Very Low’ risk tiers during Winter Storm Uri
We used ZestyAI’s Z-WATER™ to segment the property-specific non-weather water risk across the 10-day storm window. Z-WATER™ is a risk model that accounts for how plumbing design, local climate, and infrastructure reliability interact to drive non-weather water and freeze losses. By capturing real-world dynamics, such as temperature swings that stress pipes and electrical grid failures that amplify claims, the model delivers a scientifically grounded view of property-level risk.
The results were definitive: properties that Z-WATER™ scored as ‘Very High’ risk filed 26 claims per 1,000, compared to just 2.2 claims per 1,000 for those scored as ‘Very Low’, an 11X increase in claim frequency.
This accurate segmentation reveals a clear path to managing volatility. Z-WATER™ provides a deep understanding of a home’s resilience across the full spectrum of loss mechanisms, from everyday plumbing failures to expensive outlier events like Storms Uri and Fern. By enabling precise intra-territory risk splitting, the model allows carriers to price and underwrite more reliably, ensuring premiums reflect the true risk profile while protecting the portfolio against systemic losses.
The January 2026 Storm: History Rhyming?
While we can already see the immediate impact of Winter Storm Fern, the primary difference between Fern and Winter Storm Uri is the duration of the freezing event itself, rather than any changes in how quickly policyholders are filing their claims.
As shown in Figure 1, NWW claims rise rapidly as temperatures fall and taper off quickly once conditions normalize. The risk in prolonged cold events lies in how long properties stay below the Plumbing Design Temperature; the longer the freeze, the greater the likelihood of systemic plumbing failure.
During Winter Storm Uri, extended sub-freezing conditions significantly increased the number of days in which vulnerable properties were exposed to frozen pipe failures, driving aggregate losses to historic levels. Fern is now exhibiting a similar duration profile, with sub-freezing conditions persisting for up to 10 consecutive days across parts of the Northeast. The National Weather Service has warned this “could be the longest duration of cold in several decades,” raising the likelihood of elevated losses even if individual claims remain tightly clustered in time.
For carriers, the warning signs are already flashing:
- The Power Failure Multiplier: During the storm's peak, over 1 million customers lost power. In the South, where homes lack the heavy thermal insulation of northern properties, a power outage is the primary driver of catastrophic pipe bursts. Without active heating, a property can reach the "burst threshold" within hours.
- The $30,000 Claim Severity Benchmark: Recent State Farm data underscores the high stakes of these events. Winter water damage claims totaled over $628 million, with the average claim payment now exceeding $30,000. For carriers, this high per-claim severity means even a moderate frequency surge can quickly erode Q1 margins.
- Regional Fragility in the South: While the initial assessments are still surfacing, early industry estimates for privately insured losses from Winter Storm Fern puts the damage at $4 billion to $7 billion. With Texas and Tennessee identified as the hardest-hit states, carriers are facing a "Uri-style" scenario in which infrastructure wasn't designed for a 10-day deep freeze.
From Reactive to Predictive: Solving the $6.7 Billion Freeze Risk Equation
The 2021 Texas freeze taught us that traditional approaches to freeze risk are highly insufficient. Many properties that experienced burst pipes were in areas that rarely see extended freezing temperatures, meaning they lacked adequate winterization.
This is where predictive analytics becomes essential. By modelling the interaction between property-level vulnerabilities and local temperature thresholds, carriers can better identify which properties are most vulnerable to freeze events before the damage actually occurs.
Key Risk Drivers Identified in Our Latest Analysis:
- The Design Mismatch: The greatest risk isn't just the cold; it's the sudden change in temperature. Properties in states like Texas or Tennessee face a higher risk because they are built to release heat, not trap it. They lack the heavy insulation and deep-buried pipes needed to survive a 10-day freeze.
- The Power Grid Vulnerability: Our analysis shows that areas prone to power outages face a compounded risk. In the South, a home’s primary defense is its heating system so when the power fails and the heater stops, the "burst threshold" can be reached in just a few hours.
- Building Vulnerabilities: Our analysis shows that older homes and properties with plumbing routed through exterior walls are disproportionately represented among $30,000 non-weather water losses.
The Bottom Line for Carriers
The 2021 Texas freeze was a pivotal moment for the industry, generating more than 500,000 claims and $11.2 billion in insured losses in a single state. Today, Winter Storm Fern represents an even broader systemic threat, with weather alerts impacting 230 million people across more than 30 states.
While the final tally for Fern is still developing, the data is already clear: temperature shocks drive claims at exponential rates. With early industry assessments estimating privately insured losses between $4 billion and $7 billion, it is evident that the prolonged duration and geographic anomaly of extreme weather events are the primary drivers of this volatility.
For carriers looking to protect their Q1 margins, predictive analytics are no longer a luxury; they are a requirement. By analyzing property-level characteristics, regional vulnerabilities, and historical temperature deviations, you can move from reactive claims handling to proactive risk management.
The question isn't whether another major freeze will occur, but whether your portfolio is prepared for the next 126-fold surge.
Learn More About Z-WATER
ZestyAI’s Z-WATER™ provides the industry’s most granular view of interior water risk, helping carriers accurately and reliably assess properties in areas prone to temperature shock events. By analyzing detailed property-level characteristics alongside historical weather patterns and regional risk factors, our advanced models predict the likelihood of Non-Weather Water (NWW) and freeze claims as well as their associated severity. This deeper level of analysis empowers carriers to make smarter pricing decisions before the next major storm hits.
Methodology: Analysis based on aggregated claims from multiple Texas carriers during Winter Storm Uri (February 2021). Temperature data reflects mean daily minimums across the exposure footprint, weighted by ZIP Code to account for geographic density. The claim/exposure ratio was calculated by dividing daily claims by the average policy-day exposure.
-----------------------------------------------------------------
1CNN Weather, "More than 230 million people under alerts for potential ice, heavy snow and extreme cold," January 2026. [link]
2Fox News, "Noem coordinates with Mississippi officials as state recovers from deadly winter storm," January 2026. [link]
3Insurance Innovation Reporter, “KCC Estimates $6.7 Billion in Insured Losses from Winter Storm Fern,“ February 2026 [link]
4Texas Department of Insurance, "Insured Losses Resulting from the February 2021 Texas Winter Weather Event," March 2022. [link]
5Fox Business, “More than 1 million Americans lose power as monster winter storm sweeps across the US,” January 2025 [link]
6Carrier Management, “Frozen Pipes Lead to $628M in Losses for State Farm,” January, 2026 [link]
7 Barrons, “Winter Storm Fern Packed a Wallop. Now the Cost Estimates Are Rolling In.,“ February 2026 [link]
Nearly $1 Trillion in California Homes Labeled “Low Risk” Despite Elevated Wildfire Danger
Wildfire risk in the United States is no longer confined to the edges of forests or traditionally high-risk zones. New analysis using ZestyAI’s property-level wildfire models shows that millions of homes classified as low or no wildfire risk under federal assessments face elevated wildfire danger when evaluated at the property level.
This analysis was recently featured in Vox, which examined how wildfire behavior is evolving — and why broad, backward-looking risk maps are increasingly misaligned with how fires spread today.
👉 Read the full article on Vox → https://www.vox.com/climate/476932/california-wildfire-los-angeles-risk-ai-housing-climate
Wildfire risk is closer — and more granular — than most maps show
Many homes damaged or destroyed in the 2025 Los Angeles wildfires were still classified as “low risk” under federal wildfire assessments. ZestyAI’s property-level analysis provides a different perspective.
By evaluating individual structures — including vegetation proximity, defensible space, building characteristics, and neighborhood-level fire dynamics — ZestyAI identified more than 3,000 properties worth approximately $2.4 billion in areas impacted by the Palisades and Eaton fires that showed elevated wildfire risk despite being classified as low or no risk under FEMA’s census-level assessments.
Across California, the classification gap is even broader. Approximately 1.2 million properties, representing roughly $940 billion in residential property value, are designated as low or no wildfire risk under federal maps, despite AI-driven property-level models indicating elevated wildfire danger.
Why census-level wildfire maps fall short
Wildfires do not spread evenly across census tracts or counties. Ember-driven ignition, structure-to-structure spread, wind conditions, and localized vegetation patterns create uneven outcomes, where one home survives and the next is destroyed.
Federal wildfire assessments are designed to provide a baseline view of community-level risk. FEMA has noted that its National Risk Index is not intended to serve as a property-specific risk assessment. When risk is evaluated at the individual property level, meaningful differences emerge that aggregated maps are not designed to capture.
What more granular wildfire risk intelligence enables
More detailed wildfire risk data can support:
- Targeted mitigation efforts at the property and neighborhood level
- More informed rebuilding and land-use decisions
- Clearer, more defensible underwriting and portfolio strategies
- Improved dialogue between insurers, regulators, and communities
A shift in how wildfire risk is understood
Wildfire risk is evolving faster than the systems built to measure it. Homes are no longer just adjacent to wildfire hazards; they increasingly influence how fires ignite, spread, and intensify, even in dense urban environments.
Property-level risk intelligence does not remove hard decisions. But without it, those decisions are made using an incomplete picture of where wildfire risk truly exists.
Read the full Vox article here.
The Roof Age Blind Spot in P&C Insurance
Roof age is a powerful predictors of property risk, yet insurers continue to rely on self-reported data that is often wrong. Our analysis uncovers just how costly that blind spot can be.
In property insurance, roof age is one of the most critical factors in assessing risk. Yet too often, carriers rely on self-reported or agent-supplied data that is incomplete or inaccurate.
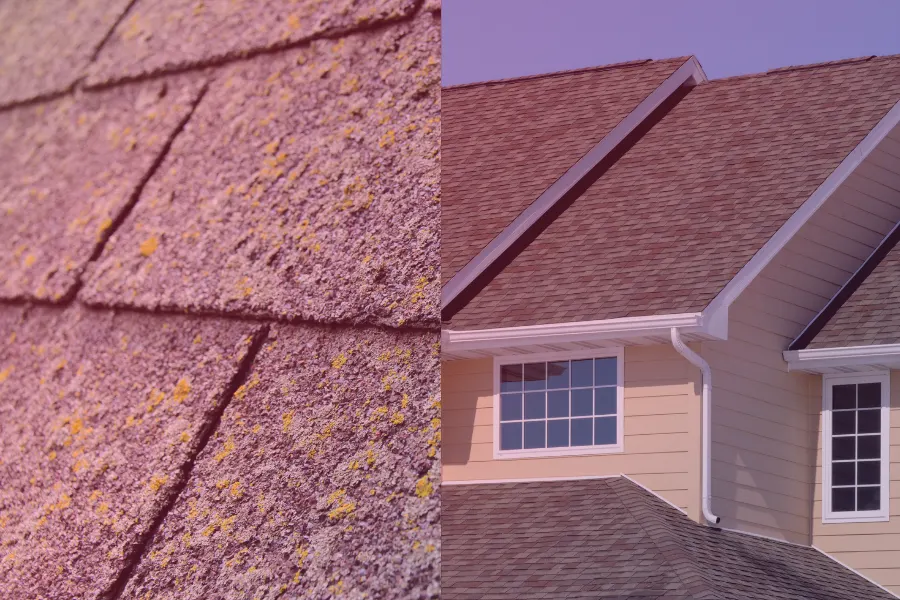
ZestyAI’s recent analysis of 500,000+ properties revealed widespread discrepancies in reported roof age. The result? Mispriced policies, unexpected losses, and operational inefficiencies that impact the bottom line.
As climate volatility grows and reinsurance pressure intensifies, overlooking the true condition and age of a home’s largest, most exposed surface is a risk no carrier can afford.
What’s Inside
- Uncover the biggest myths and blind spots in roof age records.
- Understand why traditional data sources, like claims systems and permits, fall short in providing accurate roof age.
- Learn how a multi-source verification strategy, combining aerial imagery, permits, tax records, and AI, offers a blueprint for improvement and 97% national coverage.
- Explore why roof age is a predictor of losses across multiple perils, not just wind and hail.
- Discover the one-two punch of verified roof age and real-time condition insights, delivering a complete view of risk, even for young roofs with hidden problems.
- Align your roof age data with growing regulatory expectations, particularly in states like Florida.
Deferred Maintenance Adds $317B in Exposure for Insurers
New research from ZestyAI reveals that 62% of U.S. homeowners are deferring critical home maintenance, adding up to $317 billion in potential claims exposure for insurers.
These findings come as Severe Convective Storms (SCS) caused an estimated $58 billion in insured losses in 2024, surpassing hurricane-related losses and marking the second-costliest SCS year on record.
Tornadoes, hail, and wind events now account for over 60% of all U.S. catastrophe claims, and research from the Insurance Institute for Business & Home Safety (IBHS) shows that roof damage accounts for up to 90% of residential catastrophe losses.
Key Findings from ZestyAI’s Homeowner Survey
According to ZestyAI’s nationally representative survey, 62% of homeowners have delayed essential repairs due to budget constraints, representing nearly 59 million U.S. homes with unaddressed vulnerabilities. Forty percent said they would rely on an insurance claim to cover major repairs like roof replacement, adding up to an estimated $317 billion in potential exposure for carriers.
Alarmingly, 63% of homeowners who weren’t living in their home at the time of the last roof replacement don’t know how old their roof is, making it even harder to detect aging systems before they fail. Meanwhile, 12% admitted they would delay repairs indefinitely, further increasing their risk of property damage.
Severe Convective Storms: The Growing Catastrophe Risk
This blind spot compounds known risks: prior ZestyAI analysis has identified over 12.6 million U.S. properties at high risk for hail-related roof damage, representing $189.5 billion in potential roof replacement costs.
“Deferred maintenance has long been a known risk factor, but today the stakes are higher than ever,” said Kumar Dhuvur, Co-Founder and Chief Product Officer of ZestyAI. "With claim severity rising and storm losses compounding, insurers need more than hazard maps to navigate this landscape."
"Property-level insights allow carriers to proactively address known vulnerabilities, improve underwriting precision, and work with homeowners to reduce losses before they happen.”
ZestyAI’s findings support a growing push toward data-driven, preventative underwriting strategies, especially as carriers face rising claim severity and pressure to improve combined ratios across storm-prone states.
.webp)
Now Streaming: LA Fires in Focus – What Insurers Need to Know
What Worked, What Didn’t, and What’s Next for Insurers
With insured losses projected to exceed $30 billion, the recent Los Angeles wildfires rank among the costliest in U.S. history—reshaping how insurers think about risk, resilience, and readiness.
Watch the Full Webinar → LA Fires in Focus: What Insurers Need to Know
In this on-demand webinar, experts from the Insurance Institute for Business & Home Safety (IBHS), the Western Fire Chiefs Association, Cal Poly’s WUI Fire Institute, and ZestyAI unpack what really happened—from frontline response to lab-based research and model performance—and share critical strategies insurers can use to prepare for what’s next.
Watch this session if you’re a Product Managers, Underwriters, Actuaries, and Risk & Innovation leaders looking to make informed decisions in an increasingly volatile wildfire landscape.
What You’ll Learn
- Key takeaways from the Los Angeles wildfires
- Research on structure-to-structure fire spread and resilience factors
- How wildfire risk models performed—what we got right (and wrong)
- Practical strategies to reduce exposure and strengthen resilience
Meet the Experts
- Anne Cope, Chief Engineer, IBHS
- Bob Roper, CEO, Western Fire Chiefs Association
- Frank Frievalt, Director, WUI Fire Institute at Cal Poly
- Kumar Duhvur, Co-Founder & CPO, ZestyAI
.webp)
Applied Home National Underwriters Selects ZestyAI’s Platform to Power Property Risk Analytics
Insurer adopts AI-driven models for non-weather water, hail, wind, and wildfire risks
ZestyAI today announced a new partnership with Applied Home National Underwriters to adopt ZestyAI’s full suite of regulatory-approved models and property insights in support of more accurate underwriting, pricing, and portfolio management across its U.S. property insurance operations.
This includes peril-specific models for non-weather water (Z-Water™), wildfire (Z-Fire™), hail (Z-Hail™), wind (Z-Wind™), and severe convective storm (Z-Storm™). It also includes property insights that combine aerial imagery, building permits, and parcel-level data to identify risk-relevant features such as roof condition, vegetation overhang, and secondary structures.
ZestyAI’s models use proprietary AI trained on billions of data points, including aerial imagery, parcel-level attributes, building permits, climatology, and real-world loss data, to deliver precise, property-specific risk intelligence that supports confident risk selection, loss ratio improvement, and more robust concentration management across perils.
Brian Voorhees, Chief Operating Officer, Applied Home National Underwriters, said:
“ZestyAI’s AI-powered risk models offer the kind of granular, verified intelligence that strengthens risk evaluation across a broad spectrum of perils, from climate-related threats to non-weather water.”
“This partnership deepens our commitment to innovation and precision in underwriting and portfolio management.”
“Applied Home National Underwriters is known for taking on complex risks with clarity and conviction,” said Attila Toth, Founder and CEO of ZestyAI. “We’re proud to support that with trusted, property-specific insights that help sharpen underwriting, align pricing with true risk, and strengthen portfolio performance.”
The Roof Age Blind Spot in P&C Insurance
Roof age is a powerful predictors of property risk, yet insurers continue to rely on self-reported data that is often wrong. Our analysis uncovers just how costly that blind spot can be.
In property insurance, roof age is one of the most critical factors in assessing risk. Yet too often, carriers rely on self-reported or agent-supplied data that is incomplete or inaccurate.
ZestyAI’s recent analysis of 500,000+ properties revealed widespread discrepancies in reported roof age. The result? Mispriced policies, unexpected losses, and operational inefficiencies that impact the bottom line.
As climate volatility grows and reinsurance pressure intensifies, overlooking the true condition and age of a home’s largest, most exposed surface is a risk no carrier can afford.
What’s Inside
- Uncover the biggest myths and blind spots in roof age records.
- Understand why traditional data sources, like claims systems and permits, fall short in providing accurate roof age.
- Learn how a multi-source verification strategy, combining aerial imagery, permits, tax records, and AI, offers a blueprint for improvement and 97% national coverage.
- Explore why roof age is a predictor of losses across multiple perils, not just wind and hail.
- Discover the one-two punch of verified roof age and real-time condition insights, delivering a complete view of risk, even for young roofs with hidden problems.
- Align your roof age data with growing regulatory expectations, particularly in states like Florida.
Nebraska and Kansas Approve AI-Powered Storm Models from ZestyAI Amid Escalating Weather Losses
Approvals open insurer access to property-level hail and wind risk scoring, helping carriers price coverage in two of the most climate-exposed states
ZestyAI has secured regulatory approval to use its AI-powered Severe Convective Storm models in underwriting and rating in Nebraska and Kansas. The move greenlights Z-HAIL™, Z-WIND™, and Z-STORM™, for use in property-level hail and wind scoring, giving carriers more transparency and precision in two of the nation’s most storm-prone states.
2024 Loss Trends Highlight Urgency
Kansas recorded 495 major hail events (≥1 inch) in 2024, the second-highest total of any U.S. state. Nebraska saw 100 confirmed tornadoes, the most in over 20 years. According to 2024 NAIC reporting, Nebraska posted the highest loss ratio of any state at 135.74%, while Kansas ranked 13th at 67.98%, evidence of the severe financial pressures facing insurers in the region.
Why Property-Level Intelligence Matters
ZestyAI’s Severe Convective Storm models analyze the interaction between localized climatology and property-specific characteristics, such as roof condition, design, and complexity, to predict the likelihood and severity of hail, wind, and storm damage claims. In contrast, many models still rely on broad ZIP code or territory-level risk assessments, missing critical property-level signals.
Each model is trained and validated on extensive real-world claims data and provides clear, transparent explanations of the key factors driving each score, enabling more confident underwriting and rating decisions.
Capabilities of the ZestyAI SCS Suite
- Z-HAIL: Predicts hail damage risk and claim severity using property-specific attributes such as roof complexity and accumulated damage to identify which homes are most likely to file a claim, even within the same neighborhood.
- Z-WIND: Analyzes AI-generated 3D roof condition, complexity, and potential failure points alongside local climatology to deliver pivotal insights into property-specific wind claim vulnerability and severity.
- Z-STORM: Assesses the frequency and severity of storm damage claims, including hail and wind, examining the interaction between climatology and the unique characteristics of every structure and roof.
“Securing approval in the storm epicenter of the U.S. reflects both the transparency of our models and our alignment with rigorous regulatory standards,” said Bryan Rehor, Director of Regulatory Affairs at ZestyAI.
“It gives carriers the confidence to use precise, property-level hail and wind insights where they’re needed most, supporting risk-aligned underwriting and pricing in markets facing escalating storm losses.”
ZestyAI’s Severe Convective Storm models are now approved for use in over 20 states across the Great Plains, Midwest, and U.S. South—regions most impacted by hail, wind, and tornado losses.

VYRD Selects ZestyAI to Bring AI-Powered Risk Analytics to Florida Homeowners Portfolio
Property-level insights reduce hurricane-related losses, improve risk selection, and support exposure management at scale
VYRD, a Florida-based homeowners insurance company focused on delivering stability and protection in a challenging coastal market, has partnered with ZestyAI, the leading provider of AI-powered property risk analytics, to gain deeper visibility into property condition and risk exposure across its book of business.
By leveraging the ZestyAI platform, VYRD gains access to advanced risk insights that help identify vulnerabilities contributing to hurricane-related losses, such as roof degradation, overhanging vegetation, and yard debris. These insights support more accurate underwriting, proactive portfolio management, and better visibility into changing property conditions over time.
VYRD is using two core capabilities of Z-PROPERTY: Digital Roof applies AI to high-resolution aerial imagery to assess roof complexity, materials, and condition, highlighting structural vulnerabilities before they become claims. Location Insights evaluates the broader parcel, surfacing risk factors like vegetation overhang, yard debris, and secondary structures that can amplify storm losses or drive claims severity.
“Staying ahead of risk requires strong partnerships and smarter data,” said David Howard, President and CEO of VYRD.
“ZestyAI’s ability to deliver timely, property-level insights helps us strengthen our understanding of exposure across the homes we protect and continue delivering on our promise of dependable coverage for Florida policyholders.”
Z-PROPERTY helps VYRD assess properties at scale, surface emerging risk patterns, and make more informed decisions across the policy lifecycle. This partnership extends VYRD’s tech-forward, policyholder-first strategy—using trusted data not just at point-of-quote, but throughout ongoing portfolio management.
“Florida is one of the most unforgiving insurance markets in the country,” said Attila Toth, Founder and CEO of ZestyAI. “VYRD is taking a proactive, data-driven approach—using AI to uncover hidden property-level vulnerabilities, strengthen portfolio decisions, and build resilience where it matters most.”

From High Risk to High Confidence: How One Carrier Is Rewriting the Rules of Rural Underwriting
In wildfire- and hail-prone regions, underwriting manufactured homes demands more than rules and redlines. It requires precision.
Property insurers are under growing pressure to do more with less. The risks are increasing, regulatory expectations are rising, and the margin for error keeps shrinking. In regions where wildfire, hail, and wind are intensifying, the question becomes even more urgent: how can carriers continue writing business in high-exposure areas while managing loss ratios and navigating compliance?
The challenge becomes even more complex when the homes involved are in remote locations. These properties are often far from city infrastructure, difficult to inspect, and lack consistent, structured data. That’s the reality one regional carrier faced.
Their book included thousands of rural properties, many of them manufactured homes on private land across states like Texas, Arizona, and New Mexico, as well as other regions they serve nationwide. Each presented its own underwriting hurdles, from ambiguous fire protection data to increased storm exposure and aging roof systems.
To remain active in these areas and grow responsibly, the team knew they needed a more precise way to evaluate risk at the individual property level. Broad rules were no longer enough, and legacy models designed for urban density offered little support.
The Manufactured Home Challenge: Rural, Exposed, and Hard to Inspect
Standard Casualty has specialized in insuring manufactured and modular homes for decades, serving policyholders across a wide range of states, including Texas, Arizona, and New Mexico. It’s a segment that brings unique challenges, particularly when it comes to visibility and data.
“Many of the properties we insure are located in rural areas with little to no street-level data,” said Rick Smith, Underwriting Manager at Standard Casualty.
“Some are difficult to geocode. Others are so remote that a physical on-site inspection can be challenging or expensive.”
In states like Arizona and New Mexico, many homes fall within or near the wildland-urban interface (WUI), where wildfire exposure is increasing. In Texas, hail and wind are persistent threats. And across all markets, aging structures and outdated roof data complicate rating and eligibility decisions.
The team recognized they couldn’t rely solely on fire zones or broad peril maps. They needed more nuanced, property-specific data to support confident decision-making at scale.
Getting the Full Picture, Even Without a Site Visit
“One of the big innovations for us is the availability of aerial photography,” Smith explained. “We’re seeing a lot more of our risks located in remote areas. They’re either very difficult to find or it’s very expensive to do an on-site inspection. Aerial photography really solves that problem for us.”
Using ZestyAI’s platform, the team now accesses high-resolution aerial and oblique imagery, property-specific peril scores, and roof condition insights, without always requiring physical inspections.
ZestyAI works with all the major aerial imagery providers, giving underwriters access to a broader range of coverage and more recent images than any single source could offer. That means more properties are visible, more clearly, and more often.
“We can actually accomplish through aerial photography what we can do through an on-site inspection, at a fraction of the cost, which is really important for us."
If a structure is misidentified or not aligned, underwriters can reposition the property tag themselves.
“With the ZestyAI platform, it’s very easy."
We can simply move the identifier tag with our mouse onto the correct building, click a button, and it automatically reruns the scoring and the evaluation,” Smith said.
Aerial views also improve their ability to assess roof condition and wildfire vulnerability. “Sometimes the current photo may have been taken late in the day, and there are shadows on the roof. We can back up to a photo taken six months earlier and get a clearer picture of what’s going on.”
Risk Differentiation at the Parcel Level
ZestyAI’s approach stood out by combining hazard probability with structure-specific vulnerability.
“For every peril — wildfire, hail, or wind — we now get two things,” said Smith. “First, the probability of the event occurring at that location. Second, the expected severity if it does."
"That allows us to say: these two homes are in the same neighborhood, but only one is truly high-risk.”
This dual scoring model, based on climate science and property characteristics, allows the team to evaluate each property on its own merits. “That kind of granularity is really a game changer for us in terms of underwriting,” Smith added.
Beyond Underwriting: A New Frontier in Rating and Renewal
ZestyAI’s insights also support dynamic pricing and renewals. Rather than relying on static or annual updates, risk scores adjust continuously based on the most recent information available — from new aerial imagery and roof condition changes to building permits and property improvements.
“We’re not just using the model once and forgetting it,” Smith said. “The scoring gets augmented, and as a result, the premium gets augmented as well. That means our pricing reflects current risk — not just what we assumed at inception.”
Because the models are approved for use in both underwriting and pricing, Standard Casualty can incorporate granular risk insights into its rating approach, streamlining the process of keeping rates aligned with actual conditions.
“It would take months of actuarial and analytical work to try to get to that level of granularity. And this is happening instantaneously as we renew our business.”
Retention Through Mitigation: A Smarter Approach to Non-Renewals
While many insurers are pulling back or issuing non-renewals in high-peril regions, Standard Casualty has taken a different approach: empowering policyholders to reduce their risk and stay insured.
“We can run the property eight months ahead of renewal,” Smith explained. “If we see wildfire vulnerability, we don’t just cancel. We notify the policyholder, show them what needs to change — defensible space, roof repairs, vegetation removal — and give them a chance to improve. That’s how we retain the risk and still operate responsibly.”
This proactive strategy improves retention, builds customer trust, and advances the company’s mission: improving lives by providing affordable coverage.
“This is the direction we need to go as an industry,” Smith emphasized. “We need to help policyholders understand the importance of mitigation and give them guidance so their costs — and everyone’s losses — are reduced.”
Built to Scale: Regulatory Readiness That Grows With You
One often overlooked barrier to adopting new risk models is regulatory complexity. For Standard Casualty, this was a key factor in choosing ZestyAI.
“We looked at a lot of vendors,” said Smith.
“But ZestyAI stood out because they were already approved in the states we care about and had a clear filing strategy for others.”
That alignment means the team can expand into new markets without rebuilding processes from scratch. The same tools and workflows that support Texas can be applied in Arizona, New Mexico, or future states, streamlining both operations and compliance.
“The Right Tools. The Right Decisions. The Right Time.”
As carriers navigate mounting loss pressure, tighter margins, and rising expectations from regulators and policyholders alike, Smith believes one thing will separate those who retreat from those who adapt:
“ZestyAI gives us the right tools to make the right decisions at the right time. That’s what allows us to write in places other carriers are leaving. That’s how we grow profitably, even in high-risk territories.”
Deferred Maintenance Adds $317B in Exposure for Insurers
New research from ZestyAI reveals that 62% of U.S. homeowners are deferring critical home maintenance, adding up to $317 billion in potential claims exposure for insurers.
These findings come as Severe Convective Storms (SCS) caused an estimated $58 billion in insured losses in 2024, surpassing hurricane-related losses and marking the second-costliest SCS year on record.
Tornadoes, hail, and wind events now account for over 60% of all U.S. catastrophe claims, and research from the Insurance Institute for Business & Home Safety (IBHS) shows that roof damage accounts for up to 90% of residential catastrophe losses.
Key Findings from ZestyAI’s Homeowner Survey
According to ZestyAI’s nationally representative survey, 62% of homeowners have delayed essential repairs due to budget constraints, representing nearly 59 million U.S. homes with unaddressed vulnerabilities. Forty percent said they would rely on an insurance claim to cover major repairs like roof replacement, adding up to an estimated $317 billion in potential exposure for carriers.
Alarmingly, 63% of homeowners who weren’t living in their home at the time of the last roof replacement don’t know how old their roof is, making it even harder to detect aging systems before they fail. Meanwhile, 12% admitted they would delay repairs indefinitely, further increasing their risk of property damage.
Severe Convective Storms: The Growing Catastrophe Risk
This blind spot compounds known risks: prior ZestyAI analysis has identified over 12.6 million U.S. properties at high risk for hail-related roof damage, representing $189.5 billion in potential roof replacement costs.
“Deferred maintenance has long been a known risk factor, but today the stakes are higher than ever,” said Kumar Dhuvur, Co-Founder and Chief Product Officer of ZestyAI. "With claim severity rising and storm losses compounding, insurers need more than hazard maps to navigate this landscape."
"Property-level insights allow carriers to proactively address known vulnerabilities, improve underwriting precision, and work with homeowners to reduce losses before they happen.”
ZestyAI’s findings support a growing push toward data-driven, preventative underwriting strategies, especially as carriers face rising claim severity and pressure to improve combined ratios across storm-prone states.
See How Insights Turn Into Decisions
ZestyAI transforms data into action. Get a demo to see how the same AI powering our reports helps carriers make faster, smarter, regulator-ready decisions.