
Reports & Research
Explore proprietary research packed with data, insights, and real-world findings to help carriers make smarter decisions.
Now Streaming: LA Fires in Focus – What Insurers Need to Know
What Worked, What Didn’t, and What’s Next for Insurers
With insured losses projected to exceed $30 billion, the recent Los Angeles wildfires rank among the costliest in U.S. history—reshaping how insurers think about risk, resilience, and readiness.
Watch the Full Webinar → LA Fires in Focus: What Insurers Need to Know
In this on-demand webinar, experts from the Insurance Institute for Business & Home Safety (IBHS), the Western Fire Chiefs Association, Cal Poly’s WUI Fire Institute, and ZestyAI unpack what really happened—from frontline response to lab-based research and model performance—and share critical strategies insurers can use to prepare for what’s next.
Watch this session if you’re a Product Managers, Underwriters, Actuaries, and Risk & Innovation leaders looking to make informed decisions in an increasingly volatile wildfire landscape.
What You’ll Learn
- Key takeaways from the Los Angeles wildfires
- Research on structure-to-structure fire spread and resilience factors
- How wildfire risk models performed—what we got right (and wrong)
- Practical strategies to reduce exposure and strengthen resilience
Meet the Experts
- Anne Cope, Chief Engineer, IBHS
- Bob Roper, CEO, Western Fire Chiefs Association
- Frank Frievalt, Director, WUI Fire Institute at Cal Poly
- Kumar Duhvur, Co-Founder & CPO, ZestyAI

Wildfire Risk Across the Nation
We’ve created a visual guide to where wildfire risk is rising—and where opportunities for mitigation exist.
Wildfire Risk Is Rising Nationwide
Wildfire seasons are getting longer, more destructive, and harder to predict—and they’re no longer just a Western U.S. concern. From the Southeast to the Midwest, wildfire risk is emerging in places many insurers haven’t traditionally watched.
What the Latest Data Reveals About Wildfire Exposure
Drawing from the latest national datasets and insights from ZestyAI’s Z-FIRE™ model, this visual guide to wildfire risk in the U.S. shows:
- New wildfire hotspots: Discover where risk is rising fastest.
- Mitigation gaps: Learn how a lack of defensible space is putting thousands of homes in danger across the country.
- Top risk drivers: See how features like overhanging trees and wooden roofs are fueling destruction in high-risk areas.
BONUS: You’ll also get access to our latest online event with IBHS and Western Fire Chiefs Association, The LA Fires in Focus: What Worked, What Didn’t, What’s Next for Insurers.
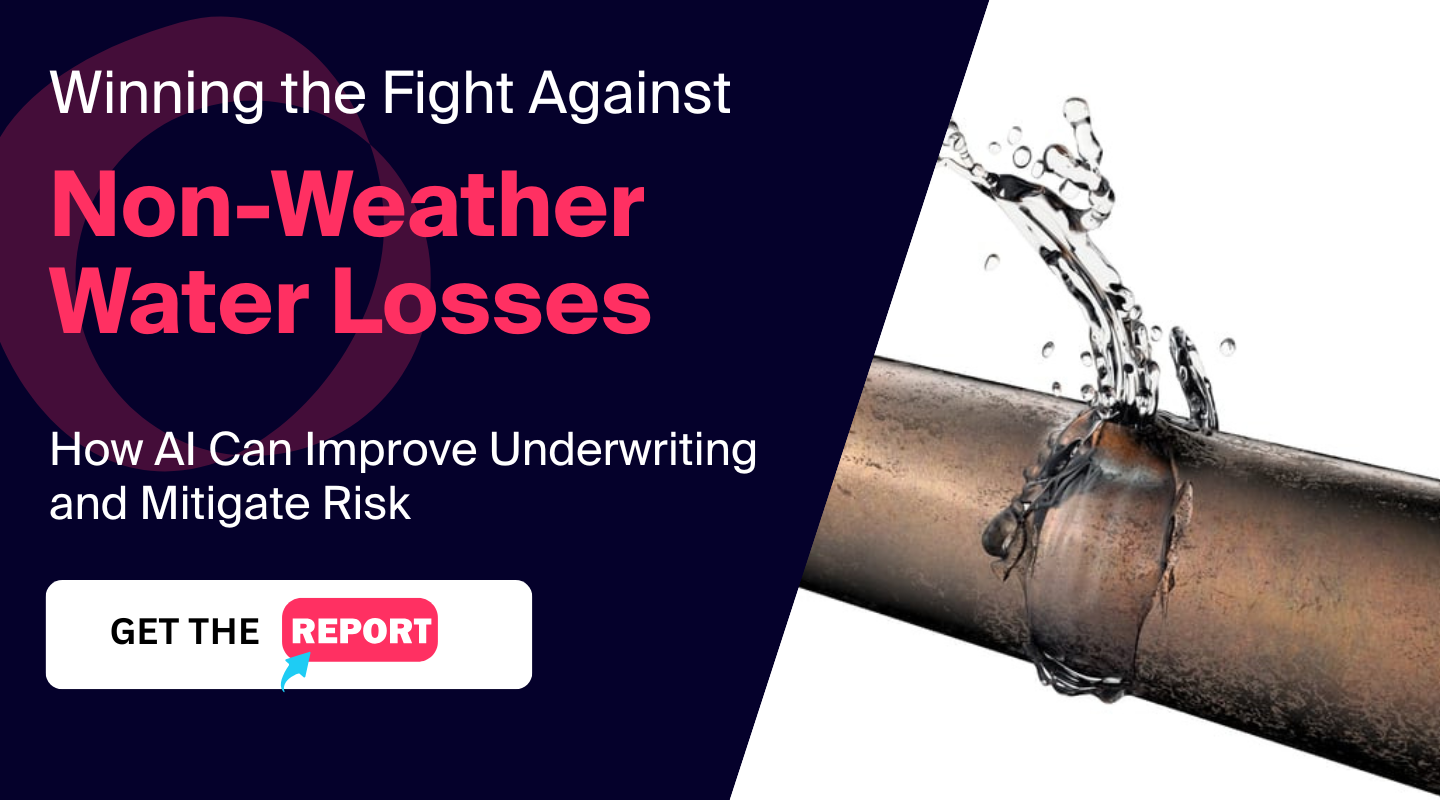
Why Non-Weather Water Losses Are Quietly Eroding Profitability
New research reveals how insurers can rethink their strategy for the 4th costliest peril in homeowners insurance
The Silent Peril Reshaping Homeowners Insurance
Non-weather water damage rarely makes headlines, but it’s quietly eroding profitability across the country.
It is now the fourth costliest peril in homeowners insurance, and claim severity has increased 80% in the last decade—a trend that’s accelerating even as frequency remains relatively flat.
Traditional risk models struggle to capture the early warning signs behind these losses, leading to mispriced policies, undetected exposure, and rising volatility for carriers.
Want the full analysis? Download the complete “Winning the Fight Against Non-Weather Water Losses” guide.
Why Loss Severity Keeps Rising
Aging homes and overlooked system failures
Many of the most expensive losses stem from aging plumbing, deteriorating materials, and slow-burn failures that often go undetected until damage is significant.
Frequency is flat—severity is not
Loss patterns suggest that while the number of events hasn’t surged, the financial impact of each event has—a signal that traditional models are not capturing the right property-level predictors.
The Property Features Most Predictive of Water Losses
The overlooked attributes that traditional models miss
Standard territory- or age-based assessments often ignore the property-specific details that meaningfully influence water loss risk, including:
- supply line material and age
- plumbing configuration
- occupancy patterns
- system maintenance and upgrades
- moisture exposure and prior loss indicators
These factors vary widely between neighboring homes—yet most models treat them as identical.
Where Traditional Underwriting Falls Short
ZIP-code and age-based proxies mask true risk
Legacy approaches rely heavily on broad territory-level assumptions that overlook structural vulnerabilities and system conditions.
Limited visibility creates mispriced policies
Without property-level insight, high-risk homes are often underpriced while lower-risk homes subsidize them—driving loss ratio volatility over time.
Get deeper insights on the drivers of water loss severity in our full guide → “Winning the Fight Against Non-Weather Water Losses”
How AI and Property-Level Data Are Changing the Landscape
AI models trained on real-world claims data can identify early signals of potential water loss by analyzing the interaction between:
- plumbing systems
- property attributes
- historical patterns
- material degradation
- repair history
This enables carriers to segment risk accurately, adjust pricing, and reduce preventable losses—long before small issues turn into major claims.
What Homeowners Actually Understand About Water Risk
Misconceptions around coverage and prevention
ZestyAI’s research shows that many policyholders:
- misunderstand what is and isn’t covered
- underestimate how much damage water can cause
- rarely take preventive actions unless prompted
This disconnect creates an opportunity for carriers to strengthen education, mitigation, and customer engagement.
Steps Carriers Can Take Today
Improve segmentation and rating accuracy
Property-level signals enable more precise risk tiers and more stable long-term portfolios.
Strengthen mitigation and reduce loss severity
Insights help identify which homes are at elevated risk and where targeted mitigation can reduce exposure.
Enhance underwriting workflows with explainable insights
Transparent, explainable AI helps underwriters understand the key drivers behind elevated risk—supporting both decision-making and regulatory review.
Get the Full Guide
Our new research paper, Winning the Fight Against Non-Weather Water Losses, breaks down the trends reshaping this growing peril—and the strategies carriers can use to get ahead of it.
Access the Guide
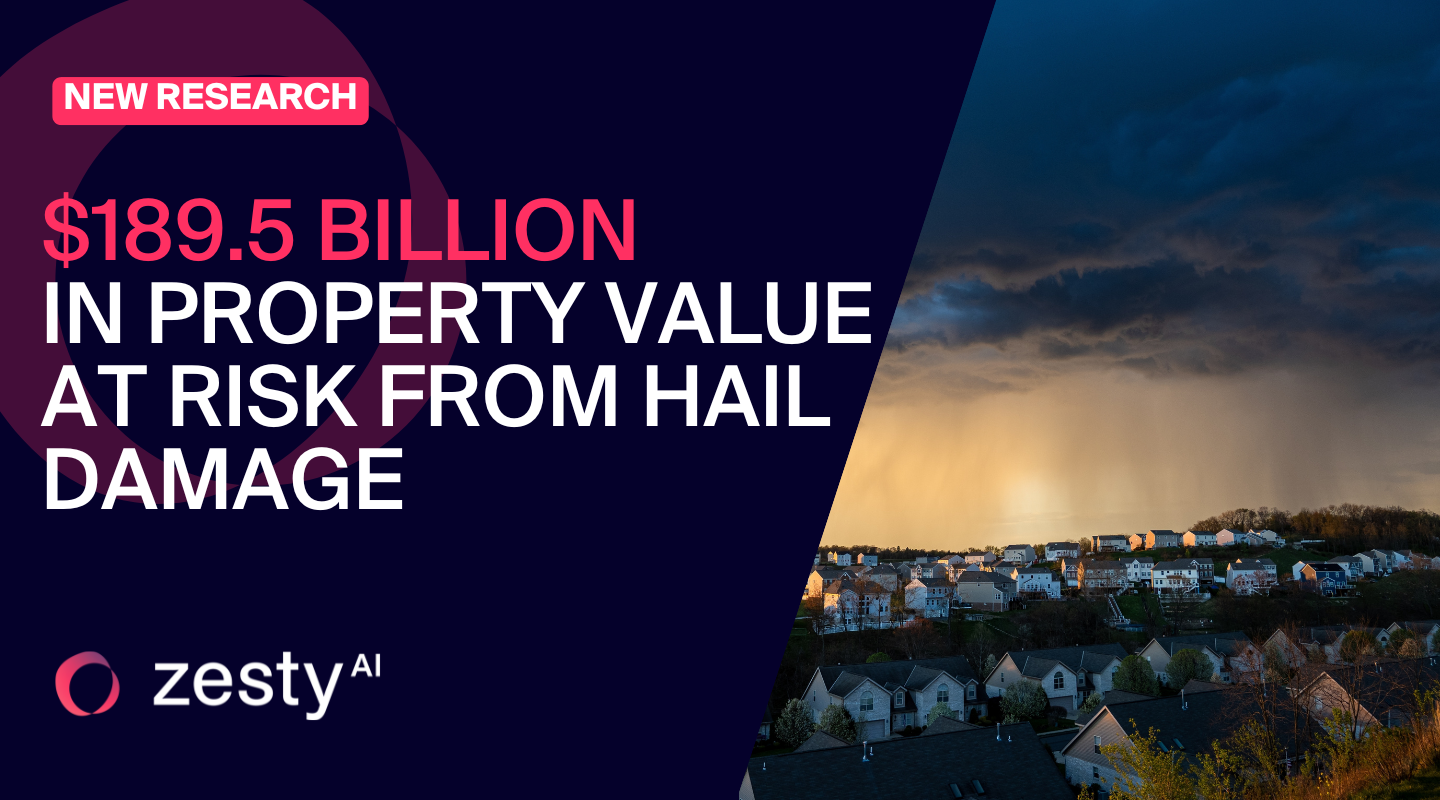
12.6 million US properties at high risk from hail damage
ZestyAI analysis reveals $189.5 billion in potential hail losses.
ZestyAI's analysis revealed that more than 12.6 million U.S. properties are at high risk of hail-related roof damage, representing $189.5 billion in potential replacement costs.
Powered by ZestyAI’s Z-HAIL™ model, the analysis underscores the growing financial threat of severe convective storms (SCS), including hail, tornadoes, and wind events. In 2024 alone, damages from SCS were estimated at $56 billion—surpassing losses from hurricanes.
Yet many insurers still rely on traditional models designed to estimate portfolio-level exposure, not property-level risk. As hail events increase in severity and frequency, these models often miss the structural and environmental conditions that drive real losses.
Kumar Dhuvur, Co-Founder and Chief Product Officer at ZestyAI said:
“Catastrophe models have helped insurers understand where storms may strike and how losses might add up at a portfolio level. But they weren’t built to assess risk at the individual property level, and they often miss the specific conditions that drive hail damage. By analyzing the interaction between structure-specific features and local storm patterns, we can distinguish risk between neighboring properties—enabling smarter underwriting, more precise pricing, and better protection for policyholders.”
Z-HAIL evaluates hail risk using a proprietary blend of climate, aerial, and property-specific data. By applying advanced machine learning to these inputs, Z-HAIL delivers highly granular predictions that reflect both the physical characteristics of a structure and the storm activity in its immediate surroundings.
Key findings from the analysis:
- 12.6 million U.S. structures flagged as high risk for hail-related roof damage
- $189.5 billion in total potential roof replacement exposure
Top five states by dollar exposure:
- Texas ($68B)
- Colorado ($16.7B)
- Illinois ($10.8B)
- North Carolina ($10.4B)
- Missouri ($9.5B)
States with the lowest dollar exposure:
- Maine ($4.7M)
- Idaho ($12.8M)
- New Hampshire ($18.5M)
- Nevada ($49.3M)
- Vermont ($64.7M)
In recent case studies, Z-HAIL has demonstrated the ability to pinpoint which properties are most susceptible to hail damage—even within the same neighborhood and exposed to the same storm. In one example from Allen, Texas, following a storm with 2.5-inch hailstones, Z-HAIL segmented risk across 483 policies, identifying no losses among properties rated “Very Low” by the model. This level of intra-territory precision gives insurers the ability to refine risk selection with confidence—even in the most hail-prone regions of the country.
.png)
2025 Storm Risk Webinar Now Available On Demand
Stream our webinar for a preview of severe convective storm risk in 2025 and see how AI-driven insights can help you stay prepared.
Severe convective storms are becoming more frequent and costly, putting pressure on insurers to refine underwriting and risk management strategies.
On April 2, our experts covered:
- Key drivers behind increasing severe storm losses
- What La Niña means for the 2025 season
- How AI-powered risk models improve risk segmentation
- Live Q&A – Get expert answers to your toughest questions!
Missed the live event? Stream now!

Report: Severe Convective Storm Preview 2025
Get the insights to manage risk in 2025 before claims surge.
Severe convective storms (SCS)—including tornadoes, hail, and damaging wind events—resulted in $58 billion in insured losses across the U.S in 2024.
Insurers face a dual challenge: navigating the uncertainty of storm patterns while ensuring their portfolios remain resilient enough to absorb the financial strain from clustered, high-loss events.
Research with IBHS confirms that SCS damage accumulates over time, particularly affecting rooftops after multiple exposures to intense storm activity. As housing stock deteriorates, insurers must reassess their portfolios to ensure underwriting, rating, and loss cost controls align with their risk appetite and maintain premiums that accurately reflect evolving exposure.
Get ahead of rising storm risks with expert insights that help you strengthen underwriting, risk assessment, and claims management.
See How Insights Turn Into Decisions
ZestyAI transforms data into action. Get a demo to see how the same AI powering our reports helps carriers make faster, smarter, regulator-ready decisions.