Reports & Research
Explore proprietary research packed with data, insights, and real-world findings to help carriers make smarter decisions.
.png)
Now Streaming: The Hidden Redesign of P&C Insurance
What 2 Million Filings Reveal About 2026 Product Strategy
P&C Insurance Is Being Rewritten - Quietly but Rapidly.
Filings from the last three years show faster shifts in P&C products than at any point in recent history - and those changes are now surfacing at scale.
Endorsements, exclusions, deductibles, and appetite resets are reshaping coverage and competitive positioning across carriers. But the pace isn't uniform. National carriers, regionals, MGAs, and farm bureaus are moving in different directions - and most teams don't have visibility into how quickly competitors are adjusting forms and filings.
This session breaks down the signals that matter for 2026 product strategy.
Drawing on 2M+ carrier filings, Stephanie Kuczynski reveals the real trends reshaping P&C product strategy headed into 2026.
You'll learn what's accelerating, where carriers diverge, and how to translate these shifts into action.
What You Will Gain
- Which changes are accelerating fastest — and where carriers diverge. State-by-state adoption patterns for endorsements, deductibles, and coverage restrictions.
- How strategies differ by carrier size and focus — niche players vs. nationals. The creative, targeted approaches emerging from regionals and MGAs versus the broad strategies deployed by national carriers.
- Where regulators are drawing the line on coverage restrictions. Prepare for closer state-level inspection, due diligence, and shifting expectations across markets.
- How these shifts impact 2026 product strategy and competitive positioning. Why the pace and direction of changes matter — and how to ensure your strategy reflects where the market is heading.
Watch Now
Why 2026 Severe Storm Losses Are Set Before the Storm Forms
Severe storm losses don't begin when a storm materializes. They're shaped earlier — by underwriting and renewal decisions, by the quality of underlying property data, and by how risk accumulates across a portfolio over time. A new ZestyAI on-demand session, featuring Robert Silva, ACAS (formerly Farmers Insurance) and Keren Chheang, FCAS (formerly Wawanesa), examines the upstream patterns driving 2026 severe convective storm (SCS) outcomes — and where traditional CAT models are diverging most sharply from realized loss.
About this session: Loss Happens Before the Storm: The New Drivers of 2026 Severe Storm Risk is an on-demand webinar covering why storm losses vary dramatically within the same ZIP code, what three record SCS years (2023: $66B, 2024: $59B, 2025: $51B) reveal about portfolio volatility, and the underwriting and pricing decisions carriers are making now. Featuring Robert Silva, ACAS, and Keren Chheang, FCAS.
Prefer to watch instead? Access the full on-demand session → — includes property-level signals, CAT model gaps, and live Q&A.
When are 2026 severe storm losses actually being set?
Earlier than most carriers price for. Once a storm forms, the loss outcome on any given property is largely determined by conditions that were locked in months or years before: roof age and condition, the property characteristics the carrier underwrote on (or didn't), the renewal decision made at the last anniversary, and the aggregate exposure the portfolio quietly accumulated through prior cycles. The storm is the trigger. The loss was already set up.
That's the framing shift behind this session. Carriers that treat storm season as the moment exposure crystallizes consistently arrive too late to influence the loss outcome.
Why are traditional CAT models misaligned with realized loss?
Because the gaps that drive loss aren't event-driven, they're data-driven. Traditional CAT models work at a level of geographic and structural abstraction that smooths over property-level variability — roof age, prior weathering, soft-metal exposure, structural state. When the building stock is uniform, that abstraction works. When it isn't — and three record years of accumulated damage mean it isn't — the modeled loss and the realized loss diverge. Carriers feel this as adverse surprise in seasons the model didn't flag.
What upstream decisions actually drive portfolio-level storm outcomes?
Four levers, in roughly the order they take effect:
- Underwriting data quality. The accuracy, coverage, and consistency of property-level information at the point of underwriting sets the ceiling for every downstream decision.
- Rating and segmentation choices. Whether structural signals — roof age, condition, prior loss exposure — are priced into the rate, or smoothed into a territory average.
- Renewal decisions. Whether deteriorating properties are repriced, repositioned, or non-renewed before the next season, or carried at the prior year's terms.
- Portfolio accumulation. Whether risk is concentrating in degraded properties or in better-conditioned ones across the book.
Each of these decisions happens long before a storm forms. Each shapes how much loss any future storm will produce.
How do property-level signals change underwriting and renewal decisions?
Property-level signals — roof condition, accumulated weathering, prior structural exposure — let carriers segment risk before it shows up as a claim. The session walks through how carriers are using this layer of intelligence to inform underwriting decisions, calibrate rating plans against structural realities the territory map can't see, and identify properties that quietly migrated from "acceptable" to "deteriorated" since the last renewal. The point isn't to write less business. It's to know which business is changing before the storm reveals it.
What this means for 2026 storm strategy
As the 2026 season takes shape, many of the loss outcomes carriers will record this year are already being set — through underwriting decisions being made now, through renewal terms being finalized, through portfolio accumulation patterns that won't be visible until they show up as concentrated loss. The session is built for product, underwriting, pricing, portfolio, actuarial, CAT, and reinsurance teams shaping how their organization shows up before the first storm forms.
Watch the full session on demand
Loss Happens Before the Storm: The New Drivers of 2026 Severe Storm Risk →
Featuring Robert Silva, ACAS (formerly Farmers Insurance) and Keren Chheang, FCAS (formerly Wawanesa), the session goes deeper on CAT model divergence, the four upstream loss drivers, and what differentiated underwriting can move on 2026 portfolio outcomes.
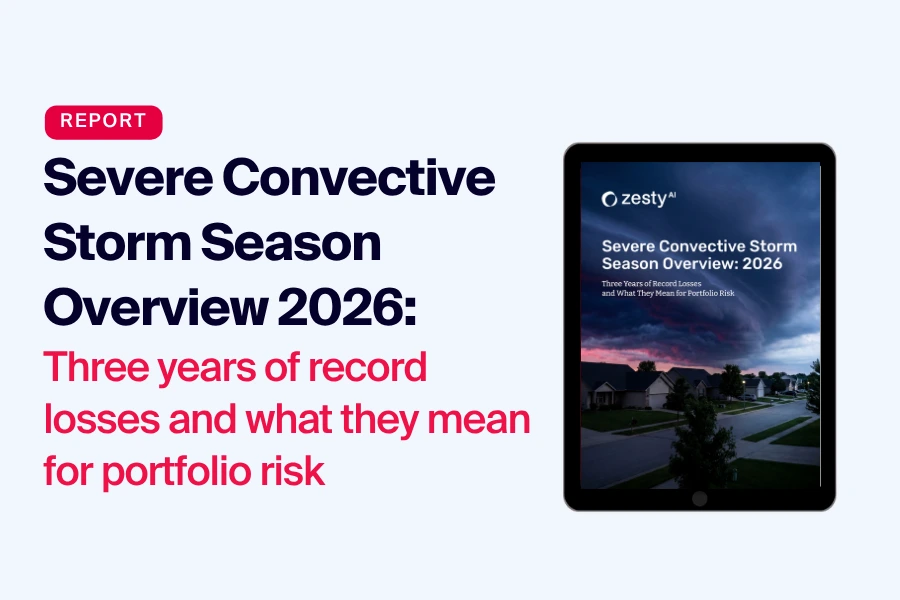
Why Severe Convective Storm Losses Now Depend More on Structure Than Geography
Three consecutive record years — $66B in insured losses in 2023, $59B in 2024, and $51B in 2025 — have reshaped how carriers need to think about severe convective storm risk. A new ZestyAI executive briefing on the 2026 SCS season shows the defining feature of these losses isn't storm frequency. It's accumulated structural damage. Within the same ZIP code, sometimes within the same complex, properties exposed to identical storms are producing materially different outcomes — and territory-level analysis is smoothing over the dispersion that actually drives the loss.
About this analysis. Findings are drawn from analysis of recent SCS seasons, IBHS research, and property-level storm segmentation across U.S. portfolios. The full briefing — 2026 Severe Convective Storm Season Overview — is a 16-page executive report covering loss dispersion patterns, peril-specific modeling, and what differentiated underwriting can actually move on portfolio performance.
Want the data? Download the full briefing → — 16 pages, immediate access.
What's driving three consecutive record SCS years?
Severe convective storm losses have accelerated steadily over the past five years, with sustained elevated activity beginning in 2020. The pattern of 2023, 2024, and 2025 — three of the highest insured-loss years on record back to back — isn't random. Underlying storm frequency has increased, but the cumulative effect on the building stock is the part most often underestimated. Each season of hail and wind exposure leaves a portfolio in a slightly more vulnerable state going into the next.
Why doesn't ZIP-code geography explain SCS loss patterns anymore?
Territory-level analysis smooths real differences between buildings. Two homes on the same street can face the same hailstorm and produce very different claims depending on roof age, roof material, prior exposure, defensible space, and the structural state of soft metals like gutters and vents. Blending those properties into a ZIP code average hides volatility that materially changes portfolio performance under stress.
That's the structural-not-geographic shift. Identical storms produce different outcomes because the structures aren't identical — and territory-level segmentation can't see it.
How does accumulated structural damage compound SCS risk?
This is the part of the story regulators and reinsurers are starting to focus on. Small hail events and ongoing weathering degrade roofing systems over time, even when no individual storm triggers a claim. Each marginal event leaves the roof slightly more vulnerable. Over a multi-year SCS cycle, the portfolios most exposed to losses are often the ones that quietly accumulated the most undamaged-but-degraded properties through prior seasons.
The implication is that a portfolio's SCS risk profile in 2026 isn't fully captured by its 2025 loss experience. The risk that didn't claim is still on the books.
Why does peril-specific modeling matter for hail and wind?
Hail, wind, and recurring micro-exposure don't behave the same way within an SCS footprint, even when they're all grouped under the same broad peril category. Hail damage concentrates in dense, often spatially clustered loss events. Straight-line wind produces a different damage signature. Recurring small-hail exposure compounds slowly across seasons. Modeling all three as a single SCS exposure obscures the separation that property-level intelligence can actually pick up — and that differentiated underwriting can actually act on.
What can property-level segmentation actually change?
In a Texas retrospective covered in the briefing, targeted underwriting actions informed by property-level segmentation would have reduced modeled loss cost by 48%. That's the magnitude of separation hiding inside portfolios that look uniform at the territory level. It's also what makes the 2026 question simpler than it sounds: not whether storms will develop, but whether the portfolio is segmented precisely enough before they do.
Get the full briefing
2026 Severe Convective Storm Season Overview →
The executive briefing walks through the multi-year SCS loss pattern, how property-level segmentation separates loss outcomes within the same footprint, and the Texas retrospective showing what differentiated underwriting can move on portfolio performance.
Where P&C Filings Go Off Track: The Execution Problem Behind Regulatory Delays
Regulatory delays in P&C filings are predictable, compounding, and largely fixable. A new ZestyAI research analysis of where filings actually break down shows the problem isn't primarily oversight — it's execution. Breakdowns cluster around a small number of recurring failure points, almost all of them early in the process, and once an objection cycle starts, delay compounds disproportionately with each round. The result is months of slippage that quietly erodes pricing effectiveness and consumes scarce actuarial and regulatory capacity.
About this analysis. Findings are drawn from analysis of recent P&C rate, rule, and form filings using Zorro Discover, ZestyAI's AI agent purpose-built for insurance-specific research. The full report — Where P&C Filings Go Off Track — is an 8-page research analysis of filing breakdowns and the execution patterns that separate teams that manage delay from those that systematically reduce it.
Want the data? Download the full report →
Where do P&C filings actually go off track?
Not where most teams assume. Filings don't typically stall during deep technical review by regulators — they stall earlier, during submission, packaging, and initial support. Procedural gaps and missing exhibits trigger objections before reviewers ever engage with the substantive content of the filing. That's the first counterintuitive finding: a meaningful share of delay is generated before the regulator has even started evaluating the rate change, model factor, or rule update being filed.
The implication is that delay is largely an upstream problem with upstream fixes.
Why does delay compound once it starts?
Each objection round resets the review clock and expands the scope of scrutiny. What looks like a small clarification request adds weeks; a second cycle adds months; a third compounds further as the reviewer's questions broaden to adjacent assumptions. Once a filing is in the objection loop, timelines stretch disproportionately, not linearly. This is the second pattern: delay is non-linear, and most filing teams don't price the compounding cost of the second and third cycle into their internal timeline forecasts.
The carriers that move fastest are the ones that prevent the first objection — not the ones that respond to it well.
What does a late effective date actually cost?
The cost of delay is measurable, even when it's not always measured. Late effective dates scale impact in two directions at once: across the premium book affected by the change, and across the time the carrier operates under the prior (often inadequate) rates. A rate change that earns full approval three months late doesn't just lose three months of expected premium — it continues exposing the carrier to the loss patterns that motivated the change in the first place. Meanwhile, actuarial and regulatory teams burn cycles managing the objection process rather than building the next filing.
What do high-performing filing teams do differently?
They treat approval readiness as an operating capability, not a one-time deliverable. High-performing teams standardize how filings are packaged, build internal review against the procedural patterns regulators care about most, and use the institutional history of prior objections — their own and the market's — to anticipate the questions a reviewer will ask before the reviewer asks them. The performance gap between organizations isn't about regulatory environment or filing volume. It's about whether the filing function is built for speed.
What this means for 2026 product execution
As filings grow more complex and regulatory expectations rise, the gap is widening between organizations that manage delay and those that systematically reduce it. The pricing decisions, product changes, and risk responses being filed today only matter to the extent they reach the market when intended. Approval readiness is increasingly what separates carriers that translate strategy into results from those that watch their best work stall in the review queue.
Get the full report
Where P&C Filings Go Off Track →
The 8-page report walks through the specific breakdown patterns, where objection cycles start, how delay compounds across rounds, and how high-performing teams systematically reduce both.
Download the report — or request a trial of Zorro Discover to access the institutional filing history that lets teams anticipate regulator objections before they arrive.

What Winter Storm Fern Reveals about Interior Water Losses and Systemic Risk
ZestyAI Product Insights
Winter Storm Fern has evolved into a historic catastrophe for the U.S. insurance industry. Between January 23-27, 2026, the storm shattered records by placing over 230 million Americans under severe winter alerts, with a death toll of 85 as of February 3rd.
Preliminary industry estimates place insured losses at $6.7 billion, potentially making Fern the third-costliest U.S. winter storm on record, trailing Elliott (2022) and Uri (2021). The crisis is far from over. The National Weather Service warns of a "historic duration" of extreme cold, with temperatures 15 to 25 degrees below average, that continues to hamper mitigation efforts.
For carriers, Fern is a complex, multi-peril challenge. Claims teams are navigating a surge of freeze-related losses, ice-driven structural damage, and widespread business interruptions across 34 states.
To understand the stakes, one needs to look no further than February 2021, when Winter Storm Uri brought Texas to its knees and generated over $11 billion in insured losses from a single state. Fern’s footprint is broader, and its secondary effects are still unfolding.
The Cold Hard Numbers from Storm Uri: Why Claims Explode Below 5°F
Our analysis of the 2021 Storm Uri reveals a striking relationship between temperature deviation and claim frequency for the non-weather water and freeze perils. Using data from multiple carriers, we tracked daily claim rates against minimum temperatures: before, during, and after the storm window (February 11-20, 2021).
The results show how rapidly falling temperatures can transform a routine winter pattern into a systemic loss event, allowing us to monitor the market’s response in real-time as conditions deteriorated, peaked, and normalized.
The results are dramatic:
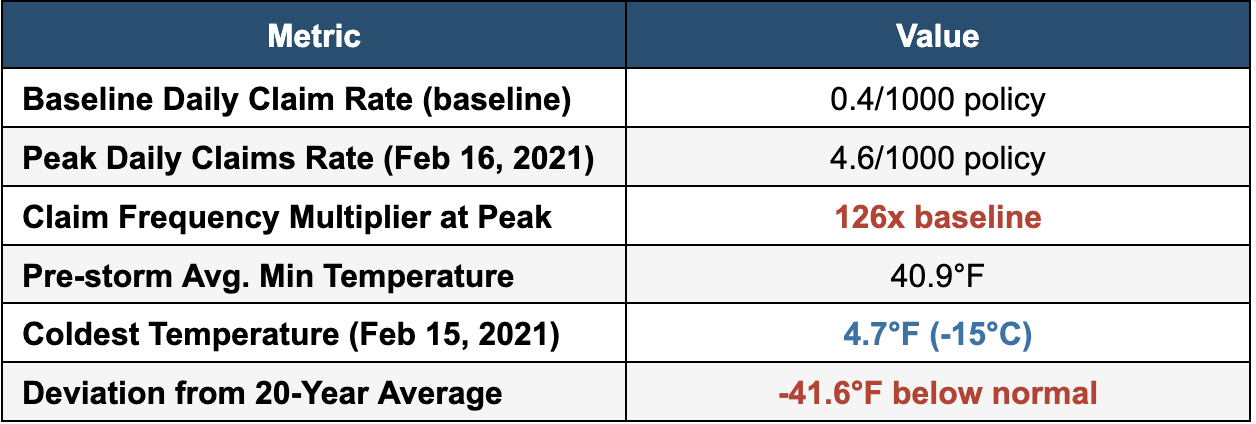
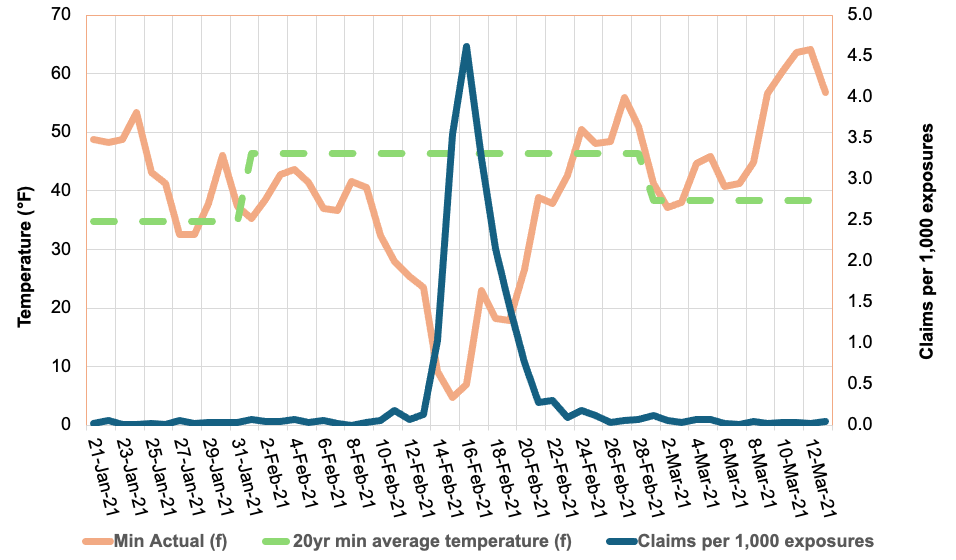
Figure 1: Daily claim rates (blue line) surged 126X above the baseline in a temporal spike as temperatures (orange line) plunged below the 20-year average (dashed green line) during Winter Storm Uri.
The chart reveals a clear inverse relationship: as minimum temperatures dropped from the mid-40s°F to below 5°F, daily claim rates didn’t just rise, they increased 126X, from a baseline of 0.04% to 0.46% at the peak. This dramatic surge underscores the significant consequences of extreme cold events on insurance liability.
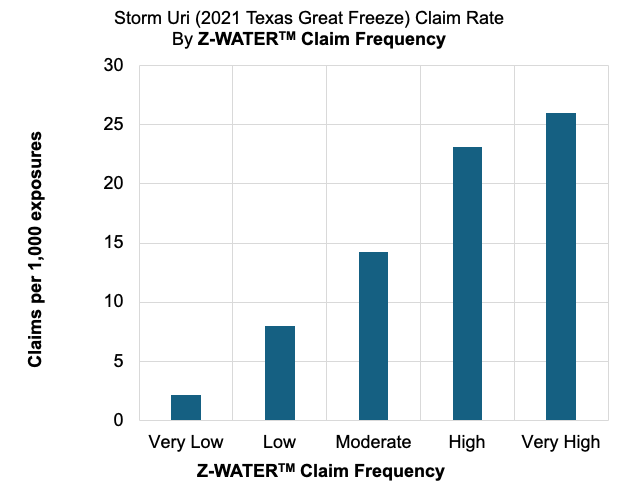
Figure 2: ZestyAI’s Z-WATER™ demonstrated an 11X increase in claim frequency between ‘Very High’ and ‘Very Low’ risk tiers during Winter Storm Uri
We used ZestyAI’s Z-WATER™ to segment the property-specific non-weather water risk across the 10-day storm window. Z-WATER™ is a risk model that accounts for how plumbing design, local climate, and infrastructure reliability interact to drive non-weather water and freeze losses. By capturing real-world dynamics, such as temperature swings that stress pipes and electrical grid failures that amplify claims, the model delivers a scientifically grounded view of property-level risk.
The results were definitive: properties that Z-WATER™ scored as ‘Very High’ risk filed 26 claims per 1,000, compared to just 2.2 claims per 1,000 for those scored as ‘Very Low’, an 11X increase in claim frequency.
This accurate segmentation reveals a clear path to managing volatility. Z-WATER™ provides a deep understanding of a home’s resilience across the full spectrum of loss mechanisms, from everyday plumbing failures to expensive outlier events like Storms Uri and Fern. By enabling precise intra-territory risk splitting, the model allows carriers to price and underwrite more reliably, ensuring premiums reflect the true risk profile while protecting the portfolio against systemic losses.
The January 2026 Storm: History Rhyming?
While we can already see the immediate impact of Winter Storm Fern, the primary difference between Fern and Winter Storm Uri is the duration of the freezing event itself, rather than any changes in how quickly policyholders are filing their claims.
As shown in Figure 1, NWW claims rise rapidly as temperatures fall and taper off quickly once conditions normalize. The risk in prolonged cold events lies in how long properties stay below the Plumbing Design Temperature; the longer the freeze, the greater the likelihood of systemic plumbing failure.
During Winter Storm Uri, extended sub-freezing conditions significantly increased the number of days in which vulnerable properties were exposed to frozen pipe failures, driving aggregate losses to historic levels. Fern is now exhibiting a similar duration profile, with sub-freezing conditions persisting for up to 10 consecutive days across parts of the Northeast. The National Weather Service has warned this “could be the longest duration of cold in several decades,” raising the likelihood of elevated losses even if individual claims remain tightly clustered in time.
For carriers, the warning signs are already flashing:
- The Power Failure Multiplier: During the storm's peak, over 1 million customers lost power. In the South, where homes lack the heavy thermal insulation of northern properties, a power outage is the primary driver of catastrophic pipe bursts. Without active heating, a property can reach the "burst threshold" within hours.
- The $30,000 Claim Severity Benchmark: Recent State Farm data underscores the high stakes of these events. Winter water damage claims totaled over $628 million, with the average claim payment now exceeding $30,000. For carriers, this high per-claim severity means even a moderate frequency surge can quickly erode Q1 margins.
- Regional Fragility in the South: While the initial assessments are still surfacing, early industry estimates for privately insured losses from Winter Storm Fern puts the damage at $4 billion to $7 billion. With Texas and Tennessee identified as the hardest-hit states, carriers are facing a "Uri-style" scenario in which infrastructure wasn't designed for a 10-day deep freeze.
From Reactive to Predictive: Solving the $6.7 Billion Freeze Risk Equation
The 2021 Texas freeze taught us that traditional approaches to freeze risk are highly insufficient. Many properties that experienced burst pipes were in areas that rarely see extended freezing temperatures, meaning they lacked adequate winterization.
This is where predictive analytics becomes essential. By modelling the interaction between property-level vulnerabilities and local temperature thresholds, carriers can better identify which properties are most vulnerable to freeze events before the damage actually occurs.
Key Risk Drivers Identified in Our Latest Analysis:
- The Design Mismatch: The greatest risk isn't just the cold; it's the sudden change in temperature. Properties in states like Texas or Tennessee face a higher risk because they are built to release heat, not trap it. They lack the heavy insulation and deep-buried pipes needed to survive a 10-day freeze.
- The Power Grid Vulnerability: Our analysis shows that areas prone to power outages face a compounded risk. In the South, a home’s primary defense is its heating system so when the power fails and the heater stops, the "burst threshold" can be reached in just a few hours.
- Building Vulnerabilities: Our analysis shows that older homes and properties with plumbing routed through exterior walls are disproportionately represented among $30,000 non-weather water losses.
The Bottom Line for Carriers
The 2021 Texas freeze was a pivotal moment for the industry, generating more than 500,000 claims and $11.2 billion in insured losses in a single state. Today, Winter Storm Fern represents an even broader systemic threat, with weather alerts impacting 230 million people across more than 30 states.
While the final tally for Fern is still developing, the data is already clear: temperature shocks drive claims at exponential rates. With early industry assessments estimating privately insured losses between $4 billion and $7 billion, it is evident that the prolonged duration and geographic anomaly of extreme weather events are the primary drivers of this volatility.
For carriers looking to protect their Q1 margins, predictive analytics are no longer a luxury; they are a requirement. By analyzing property-level characteristics, regional vulnerabilities, and historical temperature deviations, you can move from reactive claims handling to proactive risk management.
The question isn't whether another major freeze will occur, but whether your portfolio is prepared for the next 126-fold surge.
Learn More About Z-WATER
ZestyAI’s Z-WATER™ provides the industry’s most granular view of interior water risk, helping carriers accurately and reliably assess properties in areas prone to temperature shock events. By analyzing detailed property-level characteristics alongside historical weather patterns and regional risk factors, our advanced models predict the likelihood of Non-Weather Water (NWW) and freeze claims as well as their associated severity. This deeper level of analysis empowers carriers to make smarter pricing decisions before the next major storm hits.
Methodology: Analysis based on aggregated claims from multiple Texas carriers during Winter Storm Uri (February 2021). Temperature data reflects mean daily minimums across the exposure footprint, weighted by ZIP Code to account for geographic density. The claim/exposure ratio was calculated by dividing daily claims by the average policy-day exposure.
-----------------------------------------------------------------
1CNN Weather, "More than 230 million people under alerts for potential ice, heavy snow and extreme cold," January 2026. [link]
2Fox News, "Noem coordinates with Mississippi officials as state recovers from deadly winter storm," January 2026. [link]
3Insurance Innovation Reporter, “KCC Estimates $6.7 Billion in Insured Losses from Winter Storm Fern,“ February 2026 [link]
4Texas Department of Insurance, "Insured Losses Resulting from the February 2021 Texas Winter Weather Event," March 2022. [link]
5Fox Business, “More than 1 million Americans lose power as monster winter storm sweeps across the US,” January 2025 [link]
6Carrier Management, “Frozen Pipes Lead to $628M in Losses for State Farm,” January, 2026 [link]
7 Barrons, “Winter Storm Fern Packed a Wallop. Now the Cost Estimates Are Rolling In.,“ February 2026 [link]
Nearly $1 Trillion in California Homes Labeled “Low Risk” Despite Elevated Wildfire Danger
Wildfire risk in the United States is no longer confined to the edges of forests or traditionally high-risk zones. New analysis using ZestyAI’s property-level wildfire models shows that millions of homes classified as low or no wildfire risk under federal assessments face elevated wildfire danger when evaluated at the property level.
This analysis was recently featured in Vox, which examined how wildfire behavior is evolving — and why broad, backward-looking risk maps are increasingly misaligned with how fires spread today.
👉 Read the full article on Vox → https://www.vox.com/climate/476932/california-wildfire-los-angeles-risk-ai-housing-climate
Wildfire risk is closer — and more granular — than most maps show
Many homes damaged or destroyed in the 2025 Los Angeles wildfires were still classified as “low risk” under federal wildfire assessments. ZestyAI’s property-level analysis provides a different perspective.
By evaluating individual structures — including vegetation proximity, defensible space, building characteristics, and neighborhood-level fire dynamics — ZestyAI identified more than 3,000 properties worth approximately $2.4 billion in areas impacted by the Palisades and Eaton fires that showed elevated wildfire risk despite being classified as low or no risk under FEMA’s census-level assessments.
Across California, the classification gap is even broader. Approximately 1.2 million properties, representing roughly $940 billion in residential property value, are designated as low or no wildfire risk under federal maps, despite AI-driven property-level models indicating elevated wildfire danger.
Why census-level wildfire maps fall short
Wildfires do not spread evenly across census tracts or counties. Ember-driven ignition, structure-to-structure spread, wind conditions, and localized vegetation patterns create uneven outcomes, where one home survives and the next is destroyed.
Federal wildfire assessments are designed to provide a baseline view of community-level risk. FEMA has noted that its National Risk Index is not intended to serve as a property-specific risk assessment. When risk is evaluated at the individual property level, meaningful differences emerge that aggregated maps are not designed to capture.
What more granular wildfire risk intelligence enables
More detailed wildfire risk data can support:
- Targeted mitigation efforts at the property and neighborhood level
- More informed rebuilding and land-use decisions
- Clearer, more defensible underwriting and portfolio strategies
- Improved dialogue between insurers, regulators, and communities
A shift in how wildfire risk is understood
Wildfire risk is evolving faster than the systems built to measure it. Homes are no longer just adjacent to wildfire hazards; they increasingly influence how fires ignite, spread, and intensify, even in dense urban environments.
Property-level risk intelligence does not remove hard decisions. But without it, those decisions are made using an incomplete picture of where wildfire risk truly exists.
Read the full Vox article here.
See How Insights Turn Into Decisions
ZestyAI transforms data into action. Get a demo to see how the same AI powering our reports helps carriers make faster, smarter, regulator-ready decisions.