Reports & Research
Explore proprietary research packed with data, insights, and real-world findings to help carriers make smarter decisions.

What Winter Storm Fern Reveals about Interior Water Losses and Systemic Risk
ZestyAI Product Insights
Winter Storm Fern has evolved into a historic catastrophe for the U.S. insurance industry. Between January 23-27, 2026, the storm shattered records by placing over 230 million Americans under severe winter alerts, with a death toll of 85 as of February 3rd.
Preliminary industry estimates place insured losses at $6.7 billion, potentially making Fern the third-costliest U.S. winter storm on record, trailing Elliott (2022) and Uri (2021). The crisis is far from over. The National Weather Service warns of a "historic duration" of extreme cold, with temperatures 15 to 25 degrees below average, that continues to hamper mitigation efforts.
For carriers, Fern is a complex, multi-peril challenge. Claims teams are navigating a surge of freeze-related losses, ice-driven structural damage, and widespread business interruptions across 34 states.
To understand the stakes, one needs to look no further than February 2021, when Winter Storm Uri brought Texas to its knees and generated over $11 billion in insured losses from a single state. Fern’s footprint is broader, and its secondary effects are still unfolding.
The Cold Hard Numbers from Storm Uri: Why Claims Explode Below 5°F
Our analysis of the 2021 Storm Uri reveals a striking relationship between temperature deviation and claim frequency for the non-weather water and freeze perils. Using data from multiple carriers, we tracked daily claim rates against minimum temperatures: before, during, and after the storm window (February 11-20, 2021).
The results show how rapidly falling temperatures can transform a routine winter pattern into a systemic loss event, allowing us to monitor the market’s response in real-time as conditions deteriorated, peaked, and normalized.
The results are dramatic:
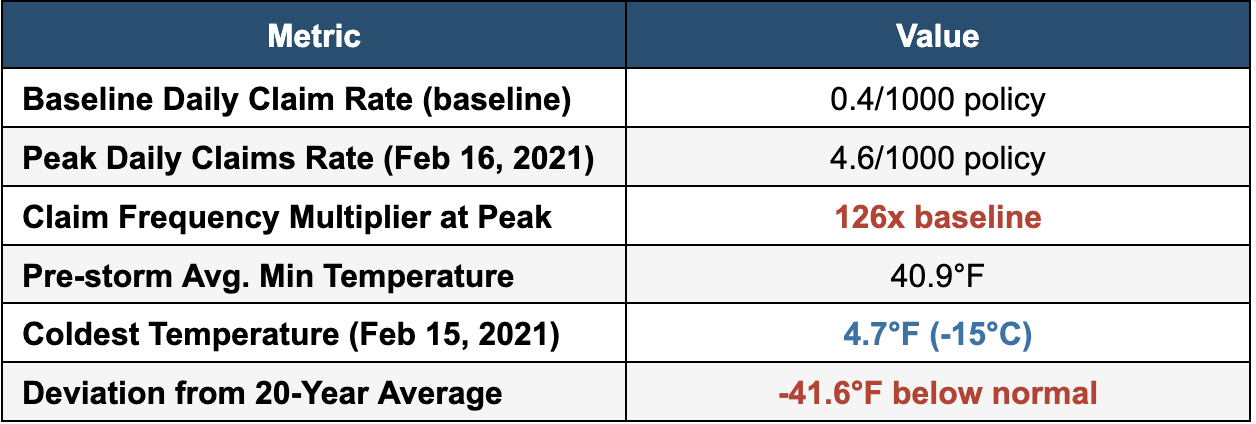
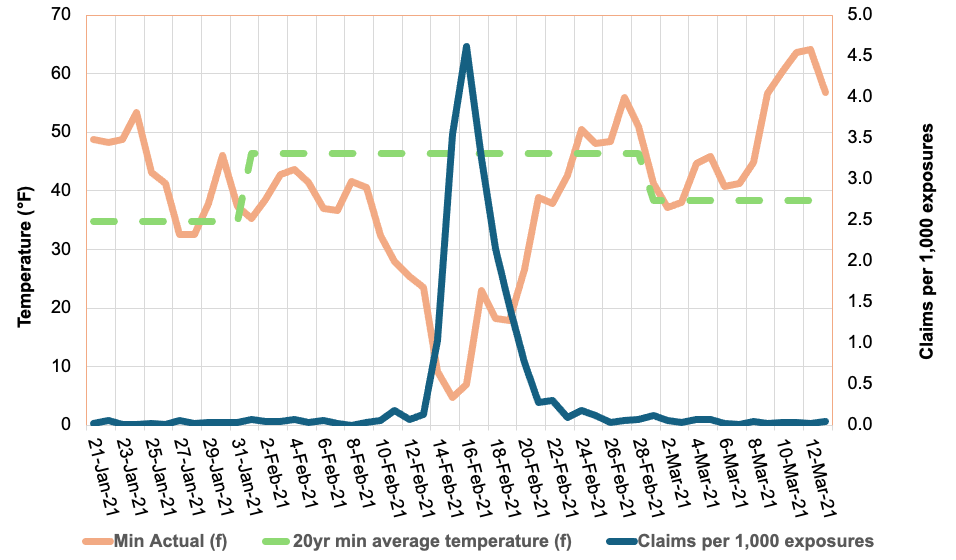
Figure 1: Daily claim rates (blue line) surged 126X above the baseline in a temporal spike as temperatures (orange line) plunged below the 20-year average (dashed green line) during Winter Storm Uri.
The chart reveals a clear inverse relationship: as minimum temperatures dropped from the mid-40s°F to below 5°F, daily claim rates didn’t just rise, they increased 126X, from a baseline of 0.04% to 0.46% at the peak. This dramatic surge underscores the significant consequences of extreme cold events on insurance liability.
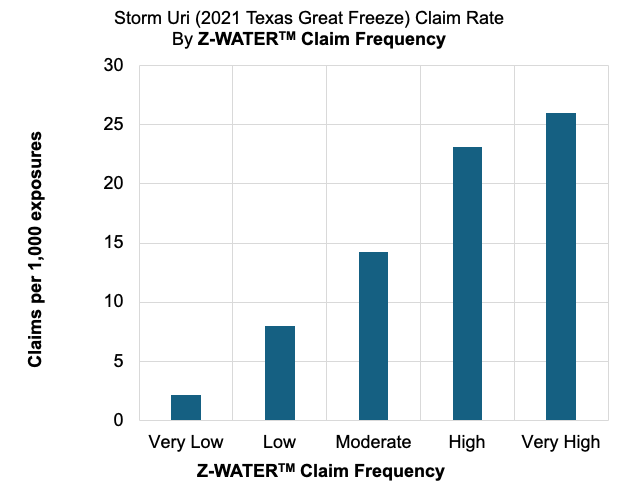
Figure 2: ZestyAI’s Z-WATER™ demonstrated an 11X increase in claim frequency between ‘Very High’ and ‘Very Low’ risk tiers during Winter Storm Uri
We used ZestyAI’s Z-WATER™ to segment the property-specific non-weather water risk across the 10-day storm window. Z-WATER™ is a risk model that accounts for how plumbing design, local climate, and infrastructure reliability interact to drive non-weather water and freeze losses. By capturing real-world dynamics, such as temperature swings that stress pipes and electrical grid failures that amplify claims, the model delivers a scientifically grounded view of property-level risk.
The results were definitive: properties that Z-WATER™ scored as ‘Very High’ risk filed 26 claims per 1,000, compared to just 2.2 claims per 1,000 for those scored as ‘Very Low’, an 11X increase in claim frequency.
This accurate segmentation reveals a clear path to managing volatility. Z-WATER™ provides a deep understanding of a home’s resilience across the full spectrum of loss mechanisms, from everyday plumbing failures to expensive outlier events like Storms Uri and Fern. By enabling precise intra-territory risk splitting, the model allows carriers to price and underwrite more reliably, ensuring premiums reflect the true risk profile while protecting the portfolio against systemic losses.
The January 2026 Storm: History Rhyming?
While we can already see the immediate impact of Winter Storm Fern, the primary difference between Fern and Winter Storm Uri is the duration of the freezing event itself, rather than any changes in how quickly policyholders are filing their claims.
As shown in Figure 1, NWW claims rise rapidly as temperatures fall and taper off quickly once conditions normalize. The risk in prolonged cold events lies in how long properties stay below the Plumbing Design Temperature; the longer the freeze, the greater the likelihood of systemic plumbing failure.
During Winter Storm Uri, extended sub-freezing conditions significantly increased the number of days in which vulnerable properties were exposed to frozen pipe failures, driving aggregate losses to historic levels. Fern is now exhibiting a similar duration profile, with sub-freezing conditions persisting for up to 10 consecutive days across parts of the Northeast. The National Weather Service has warned this “could be the longest duration of cold in several decades,” raising the likelihood of elevated losses even if individual claims remain tightly clustered in time.
For carriers, the warning signs are already flashing:
- The Power Failure Multiplier: During the storm's peak, over 1 million customers lost power. In the South, where homes lack the heavy thermal insulation of northern properties, a power outage is the primary driver of catastrophic pipe bursts. Without active heating, a property can reach the "burst threshold" within hours.
- The $30,000 Claim Severity Benchmark: Recent State Farm data underscores the high stakes of these events. Winter water damage claims totaled over $628 million, with the average claim payment now exceeding $30,000. For carriers, this high per-claim severity means even a moderate frequency surge can quickly erode Q1 margins.
- Regional Fragility in the South: While the initial assessments are still surfacing, early industry estimates for privately insured losses from Winter Storm Fern puts the damage at $4 billion to $7 billion. With Texas and Tennessee identified as the hardest-hit states, carriers are facing a "Uri-style" scenario in which infrastructure wasn't designed for a 10-day deep freeze.
From Reactive to Predictive: Solving the $6.7 Billion Freeze Risk Equation
The 2021 Texas freeze taught us that traditional approaches to freeze risk are highly insufficient. Many properties that experienced burst pipes were in areas that rarely see extended freezing temperatures, meaning they lacked adequate winterization.
This is where predictive analytics becomes essential. By modelling the interaction between property-level vulnerabilities and local temperature thresholds, carriers can better identify which properties are most vulnerable to freeze events before the damage actually occurs.
Key Risk Drivers Identified in Our Latest Analysis:
- The Design Mismatch: The greatest risk isn't just the cold; it's the sudden change in temperature. Properties in states like Texas or Tennessee face a higher risk because they are built to release heat, not trap it. They lack the heavy insulation and deep-buried pipes needed to survive a 10-day freeze.
- The Power Grid Vulnerability: Our analysis shows that areas prone to power outages face a compounded risk. In the South, a home’s primary defense is its heating system so when the power fails and the heater stops, the "burst threshold" can be reached in just a few hours.
- Building Vulnerabilities: Our analysis shows that older homes and properties with plumbing routed through exterior walls are disproportionately represented among $30,000 non-weather water losses.
The Bottom Line for Carriers
The 2021 Texas freeze was a pivotal moment for the industry, generating more than 500,000 claims and $11.2 billion in insured losses in a single state. Today, Winter Storm Fern represents an even broader systemic threat, with weather alerts impacting 230 million people across more than 30 states.
While the final tally for Fern is still developing, the data is already clear: temperature shocks drive claims at exponential rates. With early industry assessments estimating privately insured losses between $4 billion and $7 billion, it is evident that the prolonged duration and geographic anomaly of extreme weather events are the primary drivers of this volatility.
For carriers looking to protect their Q1 margins, predictive analytics are no longer a luxury; they are a requirement. By analyzing property-level characteristics, regional vulnerabilities, and historical temperature deviations, you can move from reactive claims handling to proactive risk management.
The question isn't whether another major freeze will occur, but whether your portfolio is prepared for the next 126-fold surge.
Learn More About Z-WATER
ZestyAI’s Z-WATER™ provides the industry’s most granular view of interior water risk, helping carriers accurately and reliably assess properties in areas prone to temperature shock events. By analyzing detailed property-level characteristics alongside historical weather patterns and regional risk factors, our advanced models predict the likelihood of Non-Weather Water (NWW) and freeze claims as well as their associated severity. This deeper level of analysis empowers carriers to make smarter pricing decisions before the next major storm hits.
Methodology: Analysis based on aggregated claims from multiple Texas carriers during Winter Storm Uri (February 2021). Temperature data reflects mean daily minimums across the exposure footprint, weighted by ZIP Code to account for geographic density. The claim/exposure ratio was calculated by dividing daily claims by the average policy-day exposure.
-----------------------------------------------------------------
1CNN Weather, "More than 230 million people under alerts for potential ice, heavy snow and extreme cold," January 2026. [link]
2Fox News, "Noem coordinates with Mississippi officials as state recovers from deadly winter storm," January 2026. [link]
3Insurance Innovation Reporter, “KCC Estimates $6.7 Billion in Insured Losses from Winter Storm Fern,“ February 2026 [link]
4Texas Department of Insurance, "Insured Losses Resulting from the February 2021 Texas Winter Weather Event," March 2022. [link]
5Fox Business, “More than 1 million Americans lose power as monster winter storm sweeps across the US,” January 2025 [link]
6Carrier Management, “Frozen Pipes Lead to $628M in Losses for State Farm,” January, 2026 [link]
7 Barrons, “Winter Storm Fern Packed a Wallop. Now the Cost Estimates Are Rolling In.,“ February 2026 [link]
Nearly $1 Trillion in California Homes Labeled “Low Risk” Despite Elevated Wildfire Danger
Wildfire risk in the United States is no longer confined to the edges of forests or traditionally high-risk zones. New analysis using ZestyAI’s property-level wildfire models shows that millions of homes classified as low or no wildfire risk under federal assessments face elevated wildfire danger when evaluated at the property level.
This analysis was recently featured in Vox, which examined how wildfire behavior is evolving — and why broad, backward-looking risk maps are increasingly misaligned with how fires spread today.
👉 Read the full article on Vox → https://www.vox.com/climate/476932/california-wildfire-los-angeles-risk-ai-housing-climate
Wildfire risk is closer — and more granular — than most maps show
Many homes damaged or destroyed in the 2025 Los Angeles wildfires were still classified as “low risk” under federal wildfire assessments. ZestyAI’s property-level analysis provides a different perspective.
By evaluating individual structures — including vegetation proximity, defensible space, building characteristics, and neighborhood-level fire dynamics — ZestyAI identified more than 3,000 properties worth approximately $2.4 billion in areas impacted by the Palisades and Eaton fires that showed elevated wildfire risk despite being classified as low or no risk under FEMA’s census-level assessments.
Across California, the classification gap is even broader. Approximately 1.2 million properties, representing roughly $940 billion in residential property value, are designated as low or no wildfire risk under federal maps, despite AI-driven property-level models indicating elevated wildfire danger.
Why census-level wildfire maps fall short
Wildfires do not spread evenly across census tracts or counties. Ember-driven ignition, structure-to-structure spread, wind conditions, and localized vegetation patterns create uneven outcomes, where one home survives and the next is destroyed.
Federal wildfire assessments are designed to provide a baseline view of community-level risk. FEMA has noted that its National Risk Index is not intended to serve as a property-specific risk assessment. When risk is evaluated at the individual property level, meaningful differences emerge that aggregated maps are not designed to capture.
What more granular wildfire risk intelligence enables
More detailed wildfire risk data can support:
- Targeted mitigation efforts at the property and neighborhood level
- More informed rebuilding and land-use decisions
- Clearer, more defensible underwriting and portfolio strategies
- Improved dialogue between insurers, regulators, and communities
A shift in how wildfire risk is understood
Wildfire risk is evolving faster than the systems built to measure it. Homes are no longer just adjacent to wildfire hazards; they increasingly influence how fires ignite, spread, and intensify, even in dense urban environments.
Property-level risk intelligence does not remove hard decisions. But without it, those decisions are made using an incomplete picture of where wildfire risk truly exists.
Read the full Vox article here.
Why Coverage Architecture — Not Pricing — Is the New P&C Competitive Battleground
For years, competitive analysis in P&C has centered on pricing. But a ZestyAI analysis of 2M+ carrier filings shows the real battleground has moved underneath the price tag: carriers are quietly redesigning the mechanics of coverage itself — deductibles, settlement triggers, exclusions, and conditional language — in ways that materially change loss outcomes long after the policy is bound. These changes accumulate across filings, are easy to miss until a loss occurs, and are reshaping competition more durably than rate moves ever did.
About this analysis. Findings are drawn from ZORRO Discover, ZestyAI's AI agent purpose-built for insurance-specific research. Zorro ingests every public P&C filing submitted over the past decade (2M+ filings, 200M+ pages), preserves table structure during processing, and grounds every response in source filings. The report focuses on homeowners insurance across high-pressure states, where coverage redesign is most advanced and most measurable.
Want the data? Download the full report → — with tier-by-tier and state-by-state breakdowns.
Why doesn't price competition tell the whole story anymore?
Pricing is still the most visible competitive lever, but it's also the easiest to benchmark and the fastest to neutralize. Coverage controls behave differently. A percentage-based wind/hail deductible, an actual cash value roof endorsement, or a cosmetic damage exclusion all change a carrier's loss exposure in ways that won't show up in a rate comparison and won't surface until a claim is filed. Two carriers can quote nearly identical premiums on the same property and end up with materially different exposure to a single hailstorm.
That's the shift. Coverage architecture is now where carriers are actually deciding how much risk they keep.
What are carriers actually redesigning?
Four levers do most of the work:
- Deductibles. Percentage-based wind/hail deductibles, often tiered by territory or roof material, that materially change the carrier’s loss participation before settlement even begins.
- Settlement triggers. Age- and material-based rules that move roof claims onto actual cash value (depreciated) settlement rather than full replacement cost.
- Exclusions. Cosmetic damage exclusions, anti-matching language, and growing carve-outs for soft metals (gutters, vents, frames) and solar panels.
- Conditional language. Mandatory inspections, geographic restrictions, and credits or surcharges that toggle coverage based on property characteristics.
Individually, each of these is a small mechanical change. Collectively, they redefine the product. Coverage controls aren't temporary responses to volatility anymore — they've become the baseline.
How are tier and state responses diverging under the same catastrophe conditions?
Carriers are adopting similar mechanisms — but assembling them very differently. Different tiers — nationals, large multi-line carriers, regional mutuals, and specialty writers — combine deductibles, settlement triggers, and exclusions in distinct configurations even when facing the same severe convective storm or wildfire exposure. State-level patterns diverge just as sharply: a market like Texas has converged on percentage deductibles and ACV settlement across nearly every filing, while a market like North Carolina is still standardizing the language for some endorsements at the rating bureau level.
This is what makes coverage architecture so durable as a competitive moat. Pricing differences can be matched in a single filing cycle. Coverage architecture takes years to assemble, defend at the regulator, and operationalize through underwriting and claims — and once it's in place, it's hard to undo.
What does this mean for 2026 competitive strategy?
The implication for product, underwriting, and competitive intelligence teams is straightforward: tracking competitor rate changes alone now produces an incomplete picture of the market. The carriers that win 2026 will be the ones watching the full coverage architecture — deductibles, settlement triggers, exclusions, conditional language, and how they're combined — and translating those patterns into their own product roadmaps. Filings have become both the strategy document and the audit trail. Pricing is increasingly just the cover sheet.
Get the full report
The New Competitive Battleground in P&C Insurance →
The full report walks through tier-by-tier and state-by-state adoption patterns, names the specific endorsements and conditional language reshaping homeowners coverage, and shows how loss outcomes diverge under the same catastrophe conditions when carriers assemble these levers differently.
The Hidden Redesign of P&C Insurance: What 2 Million Filings Reveal About 2026
Across personal auto, workers' compensation, commercial auto, and homeowners, P&C carriers are rewriting their products faster than at any point in the past decade — and the clearest signal isn't market commentary, it's the filings themselves. ZestyAI used ZORRO Discover™ to review more than 2 million SERFF filings, with a deep dive into 1,700+ homeowners filings across 58 carriers and $51B in premium in five severe convective storm states. The findings show carriers redesigning coverage faster than most teams can track, regulators tightening expectations alongside, and — counterintuitively — smaller carriers leading adoption of the most material changes.
About this analysis. Insights are drawn from Zorro Discover, an AI agent purpose-built for insurance-specific research. Zorro ingests every public P&C filing submitted over the past decade (2M+ filings, 200M+ pages), preserves table structure during processing, and grounds every response in source filings. The homeowners deep dive covered Texas, Oklahoma, Colorado, Ohio, and North Carolina from 2023 to 2025. Presented by Stephanie Kuczynski, Director of Risk Analytics at ZestyAI (formerly Progressive, American Integrity, and The Hartford).
Prefer to watch instead? Access the full on-demand session → — full state-by-state data, tier-by-tier breakdowns, and live Q&A.
What's changing in personal auto filings?
2025 personal auto filings show a clear divergence. Most filings remain mechanical, but a meaningful subset is layering telematics signals, vehicle feature factors, and combined rating structures into a single filing rather than tweaking one variable at a time. COVID is still in the data — many carriers continue to exclude 2020 entirely or reset older years to a post-pandemic baseline before trending forward. Meanwhile, regulators are raising the proof bar: model factors increasingly need direct statistical support to be approved.
The 2026 advantage will go to carriers that can move fast and defend each change clearly.
How is the loss cost multiplier reshaping workers' comp?
In workers' compensation, the loss cost multiplier (LCM) is no longer a tuning knob — it's become the primary economic and structural control surface, subject to continuous regulatory oversight. Carriers are building risk segmentation directly into LCM structure rather than layering it on through schedule credits, and competitive pressure now shows up as surgical, state-level LCM moves rather than broad national adjustments.
What does the rideshare picture look like in commercial auto?
The market is splitting. Some commercial auto programs decline rideshare exposure outright; others continue to write it but rate it through negotiated, individually set prices that diverge sharply between states. A handful of filings have also begun referencing autonomous and driver-assist use at the rule level — early intent signals, even where pricing isn't yet defined.
What did 1,700+ homeowners filings reveal about severe convective storm?
This is where the redesign is most visible. The most striking finding: smaller Tier 4 carriers — regional mutuals, farm bureaus, and specialty writers — are leading adoption of percentage deductibles, ACV roof endorsements, and cosmetic damage exclusions, while Tier 1 nationals tend to wait and follow. Tier 4 carriers can't spread severe convective storm exposure across geographies or perils, so they have to manage it surgically.
The financial stakes are real. A single cosmetic damage exclusion can remove 15–25% of hail claim dollars from a carrier's books, and ACV settlement can shift 30–60% of roof replacement cost back to the insured. State-level patterns diverge as much as the carrier strategies do — Texas is the most restrictive market across nearly every endorsement, while North Carolina has barely adopted cosmetic damage exclusions at all because its rating bureau is still standardizing the language.
Regulators in states like Colorado and Texas now require actuarial parity: proof that premium credits given for these endorsements match the loss reductions they're claimed to produce.
What it means for 2026 product strategy
Across every line, the same pattern emerges: better data is producing faster product moves, and regulators are responding with tighter expectations for how that complexity is supported and explained. The carriers that win 2026 will be the ones that can see competitor filing moves in days rather than weeks, defend each change with traceable evidence, and translate state-specific patterns into targeted product decisions. Filings have become both the strategy document and the audit trail.
Watch the full session on demand
The Hidden Redesign of P&C Insurance: What 2 Million Filings Reveal About 2026 Product Strategy →
The on-demand session goes deeper on the homeowners study with full tier and state breakdowns, plus live Q&A on anti-matching, solar panel exposure, ACV labor depreciation, lendability under Fannie/Freddie guidelines, and more.
Access the on-demand recording — or request a trial of Zorro Discover to run your own filings analysis on any line, state, or carrier set.
Becoming “Approval‑Ready”
Most filing delays are self-inflicted; not by regulators, but by carriers submitting filings with missing pieces, unclear narratives, or outdated requirements. In prior-approval states, those slips don’t just slow things down; they can freeze millions in premium for months. That was the core message of ZestyAI’s recent webinar, Approval‑Ready: How Carriers and Regulators Can Accelerate Filings, featuring Carter Lawrence, Commissioner of the Tennessee Department of Commerce and Insurance, and Bryan Rehor, Director of Regulatory Strategy at ZestyAI.
Watch the full session on demand here: Approval‑Ready: How Carriers and Regulators Can Accelerate Filings.
What regulators want from rate filings
Commissioner Lawrence opened with a simple reminder: regulators are people first, operating under clear statutory mandates but deeply focused on maintaining a healthy, competitive insurance market for the consumers they serve.
For carriers, that means relationships and preparation matter. He urged companies to proactively meet with departments, especially before submitting novel products or complex filings that benefit from early discussion.
Why filing delays cost insurers millions
From the carrier perspective, Bryan Rehor shared data from ZORRO Discover, ZestyAI’s agentic AI platform for competitive intelligence trained on hundreds of millions of pages of P&C filings, objection letters, and regulations. In prior‑approval states, ZORRO’s analysis shows that after the first objection, each additional objection typically adds about two months to the approval timeline, and incomplete responses can add another two to four months.
Those delays are often driven by preventable operational misses rather than disagreements over rate indications: missing actuarial exhibits, incomplete predictive model documentation, outdated checklists, procedural gaps, and under‑explained catastrophe assumptions. When ZestyAI’s team quantified the impact across lines, we estimated that delayed approvals translate into tens of millions of dollars per day in unrealized premium changes for the industry.
How ZestyAI’s ZORRO Discover helps carriers become approval‑ready
The panel converged on a key idea: the industry needs to move from reactive, objection‑driven workflows to proactive, intelligence‑driven ones. For regulators, that means using technology to reduce low‑value manual review so teams can focus on complex judgment calls; for carriers, it means embedding regulatory awareness and quality checks directly into rate filing workflows.
ZORRO Discover continuously ingests regulatory filings and related materials, so it flags gaps against current checklists, common objection themes, and emerging expectations in each state before a filing is submitted. Combined with ZestyAI’s regulator‑approved peril models and rate service organization capabilities, carriers can submit more transparent, thoroughly supported filings that earn trust and move faster through regulatory review.
FAQs: approval‑ready insurance filings and ZORRO Discover
What is ZORRO Discover from ZestyAI?
ZORRO Discover is ZestyAI’s agentic AI platform for competitive and regulatory intelligence in P&C. It analyzes 2M+ SERFF filings and related materials across all 50 states, turning millions of pages into real-time, citation-backed insights. For regulatory teams, it surfaces objection patterns and regulator expectations upfront, improving research efficiency by 20X. This helps teams run faster and more accurate pre-submission QA, draft cleaner filings, accelerate approvals, and reduce adverse selection.
How can insurance-specific AI reduce filing objections?
Agentic AI platforms for competitive intelligence, such as ZORRO Discover, scan millions of filings and related materials, including checklists, statutes, and historic objection letters. They help teams flag missing actuarial support, outdated checklists, weak justifications, and documentation gaps before submission. This “pre‑flight” QA reduces procedural errors that trigger avoidable objections and multi‑month delays.
How does ZestyAI help carriers be "approval-ready”?
ZestyAI helps carriers be approval-ready by strengthening both the models they file and the way those filings are prepared. Our peril models are filed through a Rate Service Organization (RSO) with standardized, regulator-tested documentation and a growing track record of approvals that carriers can reference as precedent. On the process side, ZORRO Discover provides pre-submission QA using regulatory objections and competitive insights. Together, this gives carriers more complete, regulator-aligned filings, fewer avoidable objections, and faster, more predictable approval timelines.
Why do prior‑approval states create unique challenges?
In prior‑approval states, rate and product changes cannot take effect until they are signed off by the Department of Insurance (DOI), so each objection round adds real financial cost as actuarially indicated changes sit idle. ZORRO Discover’s analysis shows that every additional objection can add months to the timeline, making operational quality and proactive compliance crucial levers for profitability.
How does ZestyAI support regulators and carriers at the same time?
ZestyAI reduces friction on both sides of the filing process by providing regulators with better documentation and helping carriers.
For regulators:
- Standardized, RSO-filed model documentation that’s easy to review.
- Regulatory precedent from prior approvals, reducing model-review burden.
- Clear, transparent methodology aligned with statutory expectations.
For carriers:
- Faster approvals by referencing ZestyAI’s existing model approvals.
- Fewer avoidable objections through ZORRO Discover’s QA and objection-pattern insights.
- More complete, regulator-aligned filings with clearer documentation and rationale.
Outcome:
Regulators receive fully documented, RSO-filed models that are easier to review and validate. Carriers benefit from two advantages:
- Clear insight into regulatory expectations to help them avoid common filing errors.
- The ability to reference ZestyAI’s existing model approvals, which provides regulatory precedent and helps their own filings move through review more quickly.
Together, this reduces avoidable objections and creates a more efficient, predictable approval process for both sides.
To hear directly from Commissioner Carter Lawrence and ZestyAI’s regulatory experts, watch the full webinar on demand: Approval‑Ready: How Carriers and Regulators Can Accelerate Filings

How P&C Carriers Are Using Agentic AI for Competitive Intelligence
Competitive intelligence in P&C insurance is still slow, manual, and scattered across PDFs — and the gap between when a competitor files a rate change and when most carriers learn about it is measured in weeks rather than days. Agentic AI is collapsing that gap. A ZestyAI on-demand session shows how analysts, actuaries, product managers, and compliance leads are using Zorro Discover™, ZestyAI's purpose-built agentic AI for insurance, to surface competitor rate changes, coverage shifts, regulatory objections, and trend data in seconds rather than hours.
About this session. Real-Time Market Intelligence for P&C Carriers is a live walkthrough of how agentic AI is being applied to filing research and competitive analysis in P&C insurance. Hosted by Somayaji Ayalasomayajula, Product Manager at ZestyAI, and Sam Fetchero, Head of Marketing.
Prefer to watch instead? Access the full on-demand session → — includes a live Zorro Discover walkthrough and early-customer reactions.
Why is traditional P&C competitive intelligence so slow?
Because the source material is unstructured. Filing data lives across SERFF, state DOI portals, and individual carrier submissions — in PDFs, rate manuals, rule pages, exhibits, and objection responses. Each filing is a multi-document package that has to be retrieved, opened, read, and synthesized to answer even simple questions: What did Carrier X change in their roof endorsement? How did the regulator respond to the wildfire surcharge? Which carriers added telematics factors in the last cycle? Multiply that across every competitor, every state, and every filing cycle, and the workflow becomes the bottleneck. Most teams cope by sampling — tracking a few competitors closely and missing everything else.
The result is a structural latency problem. By the time the relevant insight reaches the product or pricing team, the market has often already moved.
What is agentic AI for insurance competitive intelligence?
Agentic AI for insurance competitive intelligence is AI built to autonomously search, interpret, and synthesize regulatory filings — including rate manuals, rule pages, forms, exhibits, and objection cycles — and return specific answers about competitor behavior, regulatory trends, or filing strategy without requiring an analyst to manually retrieve and parse the underlying documents.
What separates it from general-purpose AI is grounding. Agentic AI for insurance is constrained to insurance-specific source material (every public P&C filing, in Zorro Discover's case), optimized for insurance language and structure (rate manuals, rule pages, statutes, actuarial guidance), and built to preserve filing structure during retrieval so tables, exhibits, and multi-document packages can be reconstructed during analysis.
The practical effect: research that used to take a competitive intelligence analyst hours or days returns in seconds, with citations back into the source filings.
What questions can carriers actually answer in seconds?
The patterns that show up most often in real use:
- Competitor rate change tracking. Surface the substance of a competitor's filing the moment it's published, not weeks later.
- Coverage and endorsement shifts. Identify changes to deductibles, exclusions, settlement triggers, and conditional language across carriers in a state or peril.
- Objection and approval patterns. Pull the full objection history on a topic — wildfire surcharges, AI-based factors, telematics — and craft regulator responses against what's already been approved or contested.
- Cross-state and cross-carrier comparison. Compare how carriers are filing the same concept across multiple states, or how a single carrier is positioning differently across regions.
- Trend analysis. Aggregate filing patterns to surface the slower-moving shifts — segmentation moving upstream into LCMs, accumulating coverage controls, regulator focus areas — that don't show up in any single filing.
Where does this fit in the carrier workflow?
The session is designed for analysts, actuaries, product managers, compliance leads, and underwriting strategy teams — the people whose decisions depend on knowing what competitors and regulators are actually doing right now. The bigger shift it points to: competitive intelligence is becoming less about who has the most analysts manually reading filings, and more about which carriers can route filing intelligence directly into the hands of the people making product and pricing decisions. Speed-to-insight is increasingly the moat.
Watch the full session on demand
Real-Time Market Intelligence for P&C Carriers →
See how analysts, actuaries, and product strategy teams are using Zorro Discover™ to track competitor filings, coverage shifts, and regulatory objections in real time — and what early users are saying about the workflow change.
Watch the on-demand session — or request a trial of Zorro Discover to run the same analysis against your own competitive set.
See How Insights Turn Into Decisions
ZestyAI transforms data into action. Get a demo to see how the same AI powering our reports helps carriers make faster, smarter, regulator-ready decisions.