Reports & Research
Explore proprietary research packed with data, insights, and real-world findings to help carriers make smarter decisions.
.png)

Wildfire Risk Across the Nation
We’ve created a visual guide to where wildfire risk is rising—and where opportunities for mitigation exist.
Wildfire Risk Is Rising Nationwide
Wildfire seasons are getting longer, more destructive, and harder to predict—and they’re no longer just a Western U.S. concern. From the Southeast to the Midwest, wildfire risk is emerging in places many insurers haven’t traditionally watched.
What the Latest Data Reveals About Wildfire Exposure
Drawing from the latest national datasets and insights from ZestyAI’s Z-FIRE™ model, this visual guide to wildfire risk in the U.S. shows:
- New wildfire hotspots: Discover where risk is rising fastest.
- Mitigation gaps: Learn how a lack of defensible space is putting thousands of homes in danger across the country.
- Top risk drivers: See how features like overhanging trees and wooden roofs are fueling destruction in high-risk areas.
BONUS: You’ll also get access to our latest online event with IBHS and Western Fire Chiefs Association, The LA Fires in Focus: What Worked, What Didn’t, What’s Next for Insurers.
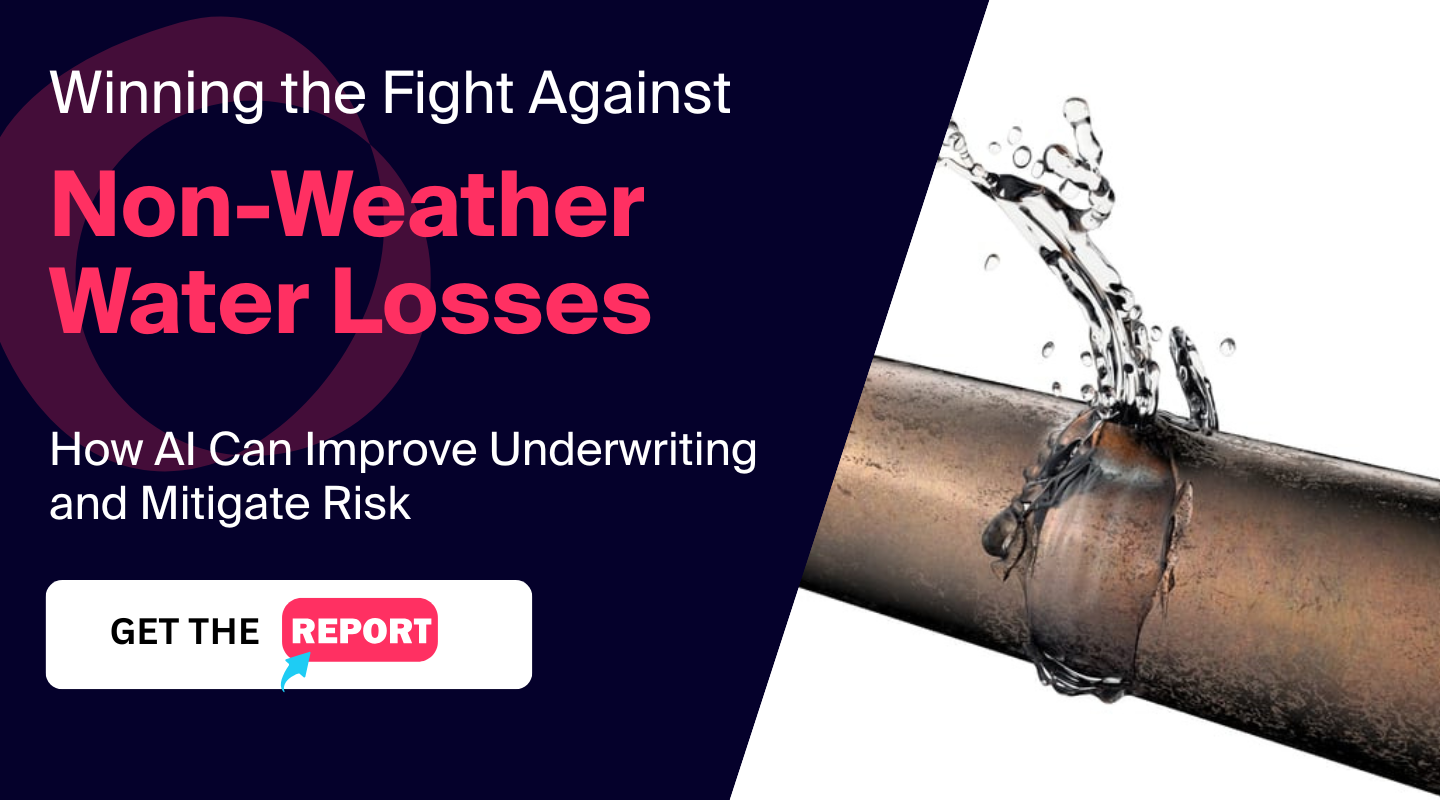
Why Non-Weather Water Losses Are Quietly Eroding Profitability
New research reveals how insurers can rethink their strategy for the 4th costliest peril in homeowners insurance
The Silent Peril Reshaping Homeowners Insurance
Non-weather water damage rarely makes headlines, but it’s quietly eroding profitability across the country.
It is now the fourth costliest peril in homeowners insurance, and claim severity has increased 80% in the last decade—a trend that’s accelerating even as frequency remains relatively flat.
Traditional risk models struggle to capture the early warning signs behind these losses, leading to mispriced policies, undetected exposure, and rising volatility for carriers.
Want the full analysis? Download the complete “Winning the Fight Against Non-Weather Water Losses” guide.
Why Loss Severity Keeps Rising
Aging homes and overlooked system failures
Many of the most expensive losses stem from aging plumbing, deteriorating materials, and slow-burn failures that often go undetected until damage is significant.
Frequency is flat—severity is not
Loss patterns suggest that while the number of events hasn’t surged, the financial impact of each event has—a signal that traditional models are not capturing the right property-level predictors.
The Property Features Most Predictive of Water Losses
The overlooked attributes that traditional models miss
Standard territory- or age-based assessments often ignore the property-specific details that meaningfully influence water loss risk, including:
- supply line material and age
- plumbing configuration
- occupancy patterns
- system maintenance and upgrades
- moisture exposure and prior loss indicators
These factors vary widely between neighboring homes—yet most models treat them as identical.
Where Traditional Underwriting Falls Short
ZIP-code and age-based proxies mask true risk
Legacy approaches rely heavily on broad territory-level assumptions that overlook structural vulnerabilities and system conditions.
Limited visibility creates mispriced policies
Without property-level insight, high-risk homes are often underpriced while lower-risk homes subsidize them—driving loss ratio volatility over time.
Get deeper insights on the drivers of water loss severity in our full guide → “Winning the Fight Against Non-Weather Water Losses”
How AI and Property-Level Data Are Changing the Landscape
AI models trained on real-world claims data can identify early signals of potential water loss by analyzing the interaction between:
- plumbing systems
- property attributes
- historical patterns
- material degradation
- repair history
This enables carriers to segment risk accurately, adjust pricing, and reduce preventable losses—long before small issues turn into major claims.
What Homeowners Actually Understand About Water Risk
Misconceptions around coverage and prevention
ZestyAI’s research shows that many policyholders:
- misunderstand what is and isn’t covered
- underestimate how much damage water can cause
- rarely take preventive actions unless prompted
This disconnect creates an opportunity for carriers to strengthen education, mitigation, and customer engagement.
Steps Carriers Can Take Today
Improve segmentation and rating accuracy
Property-level signals enable more precise risk tiers and more stable long-term portfolios.
Strengthen mitigation and reduce loss severity
Insights help identify which homes are at elevated risk and where targeted mitigation can reduce exposure.
Enhance underwriting workflows with explainable insights
Transparent, explainable AI helps underwriters understand the key drivers behind elevated risk—supporting both decision-making and regulatory review.
Get the Full Guide
Our new research paper, Winning the Fight Against Non-Weather Water Losses, breaks down the trends reshaping this growing peril—and the strategies carriers can use to get ahead of it.
Access the Guide
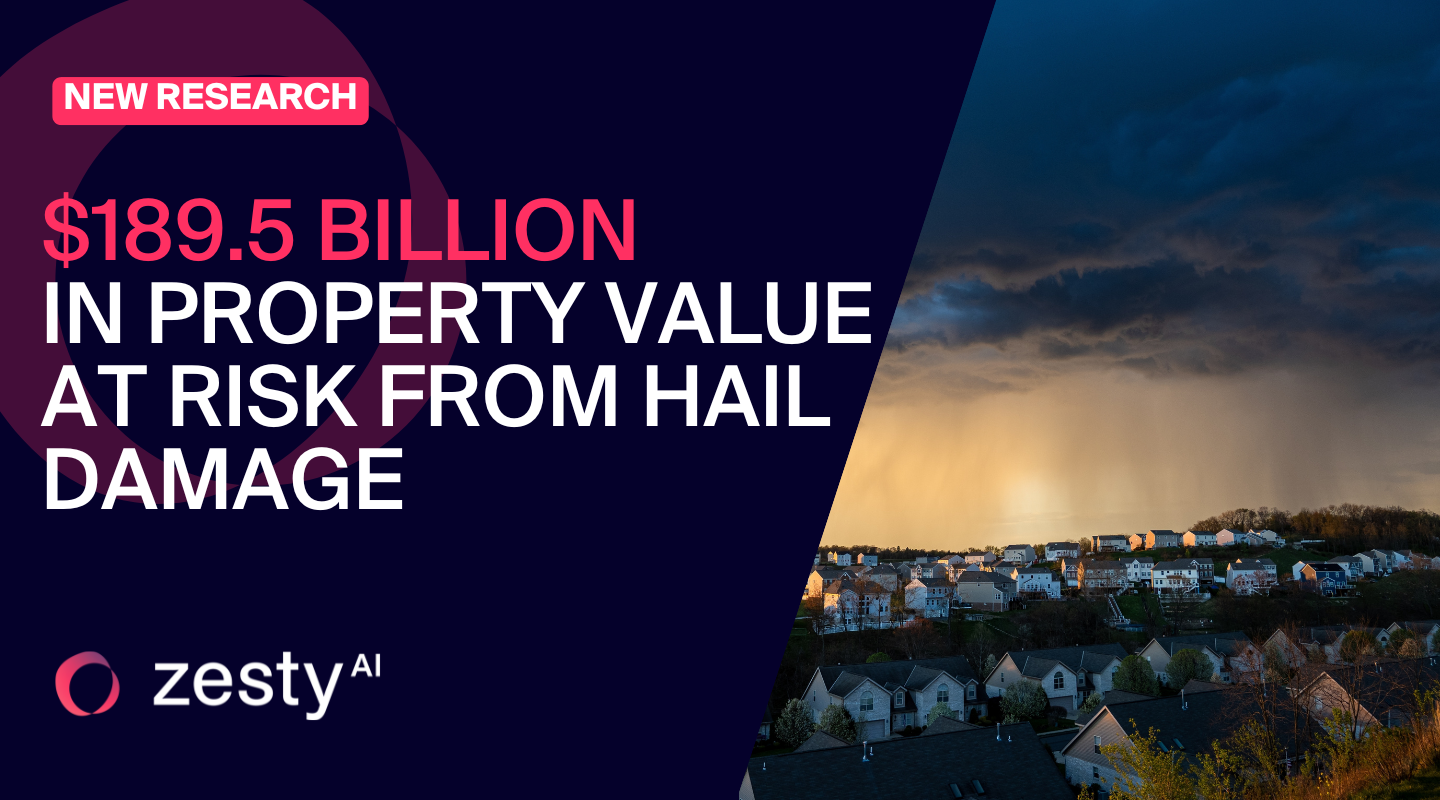
12.6 million US properties at high risk from hail damage
ZestyAI analysis reveals $189.5 billion in potential hail losses.
ZestyAI's analysis revealed that more than 12.6 million U.S. properties are at high risk of hail-related roof damage, representing $189.5 billion in potential replacement costs.
Powered by ZestyAI’s Z-HAIL™ model, the analysis underscores the growing financial threat of severe convective storms (SCS), including hail, tornadoes, and wind events. In 2024 alone, damages from SCS were estimated at $56 billion—surpassing losses from hurricanes.
Yet many insurers still rely on traditional models designed to estimate portfolio-level exposure, not property-level risk. As hail events increase in severity and frequency, these models often miss the structural and environmental conditions that drive real losses.
Kumar Dhuvur, Co-Founder and Chief Product Officer at ZestyAI said:
“Catastrophe models have helped insurers understand where storms may strike and how losses might add up at a portfolio level. But they weren’t built to assess risk at the individual property level, and they often miss the specific conditions that drive hail damage. By analyzing the interaction between structure-specific features and local storm patterns, we can distinguish risk between neighboring properties—enabling smarter underwriting, more precise pricing, and better protection for policyholders.”
Z-HAIL evaluates hail risk using a proprietary blend of climate, aerial, and property-specific data. By applying advanced machine learning to these inputs, Z-HAIL delivers highly granular predictions that reflect both the physical characteristics of a structure and the storm activity in its immediate surroundings.
Key findings from the analysis:
- 12.6 million U.S. structures flagged as high risk for hail-related roof damage
- $189.5 billion in total potential roof replacement exposure
Top five states by dollar exposure:
- Texas ($68B)
- Colorado ($16.7B)
- Illinois ($10.8B)
- North Carolina ($10.4B)
- Missouri ($9.5B)
States with the lowest dollar exposure:
- Maine ($4.7M)
- Idaho ($12.8M)
- New Hampshire ($18.5M)
- Nevada ($49.3M)
- Vermont ($64.7M)
In recent case studies, Z-HAIL has demonstrated the ability to pinpoint which properties are most susceptible to hail damage—even within the same neighborhood and exposed to the same storm. In one example from Allen, Texas, following a storm with 2.5-inch hailstones, Z-HAIL segmented risk across 483 policies, identifying no losses among properties rated “Very Low” by the model. This level of intra-territory precision gives insurers the ability to refine risk selection with confidence—even in the most hail-prone regions of the country.
.png)
2025 Storm Risk Webinar Now Available On Demand
Stream our webinar for a preview of severe convective storm risk in 2025 and see how AI-driven insights can help you stay prepared.
Severe convective storms are becoming more frequent and costly, putting pressure on insurers to refine underwriting and risk management strategies.
On April 2, our experts covered:
- Key drivers behind increasing severe storm losses
- What La Niña means for the 2025 season
- How AI-powered risk models improve risk segmentation
- Live Q&A – Get expert answers to your toughest questions!
Missed the live event? Stream now!

Report: Severe Convective Storm Preview 2025
Get the insights to manage risk in 2025 before claims surge.
Severe convective storms (SCS)—including tornadoes, hail, and damaging wind events—resulted in $58 billion in insured losses across the U.S in 2024.
Insurers face a dual challenge: navigating the uncertainty of storm patterns while ensuring their portfolios remain resilient enough to absorb the financial strain from clustered, high-loss events.
Research with IBHS confirms that SCS damage accumulates over time, particularly affecting rooftops after multiple exposures to intense storm activity. As housing stock deteriorates, insurers must reassess their portfolios to ensure underwriting, rating, and loss cost controls align with their risk appetite and maintain premiums that accurately reflect evolving exposure.
Get ahead of rising storm risks with expert insights that help you strengthen underwriting, risk assessment, and claims management.
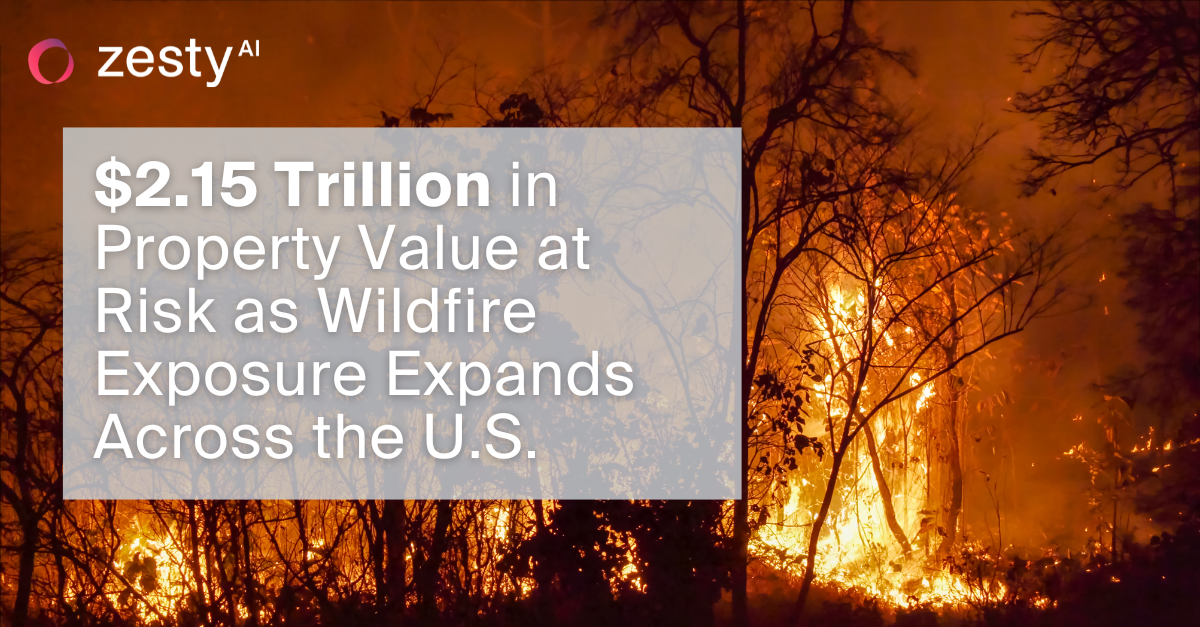
$2.15 Trillion in Property Value at Risk as Wildfire Exposure Expands Across the U.S.
ZestyAI Identifies 4.3 Million U.S. Homes with High Wildfire Risk.
A staggering $2.15 trillion worth of U.S. residential property is at high risk of wildfire damage, according to a new AI-powered analysis from ZestyAI, the leader in climate and property risk analytics. The study, which assessed 126 million properties nationwide, found that 4.3 million individual homes face heightened wildfire risk—far beyond traditionally recognized high-risk areas.
Using advanced AI models trained on over 2,000 historical wildfires, ZestyAI mapped wildfire exposure at the property level, integrating satellite and aerial imagery, topography, and structure-specific characteristics. While California leads the nation with $1.16 trillion in wildfire-exposed property, other states such as Colorado ($190.5 billion), Utah ($100.3 billion), and North Carolina ($71.2 billion) also face significant risk.
Wildfire Risk is a Nationwide Challenge
While the Western U.S. has historically seen the most severe wildfire activity, ZestyAI’s findings confirm that high-risk properties exist across the country. States like North Carolina (4.6% of homes at high risk), Kentucky (2.9%), Tennessee (2.3%), and even South Dakota (11.0%) are now seeing increased wildfire exposure.
As more homes and businesses are built in fire-prone landscapes, the Wildland-Urban Interface (WUI) continues to expand. This, combined with intensifying climate conditions, is driving higher insurance costs and growing availability concerns. Today, one in eight U.S. homeowners already lacks adequate insurance coverage, and that number is expected to rise.
AI Expands Insurance Access in High-Risk Areas
Attila Toth, Founder and CEO of ZestyAI said:
"Wildfires are threatening more properties than ever before, with billions of dollars in exposure even in areas many people don’t associate with fire risk. Yet, too many homeowners are finding themselves uninsured or underinsured just as these disasters become more frequent and severe. Insurers have traditionally relied on broad, regional models that don’t account for individual property characteristics."
"That means some homeowners are denied coverage even when their true risk is much lower than their neighbors'.’"
AI-driven risk analytics are reshaping the way insurers assess wildfire exposure. By providing granular, property-specific insights, we’re helping insurers make smarter underwriting decisions—keeping coverage available in high-risk areas while ensuring that homeowners who take mitigation steps are recognized.
Last year, our models helped insurers extend coverage to 511,000 properties that had previously struggled to secure insurance due to outdated risk models. In 2025, we expect that number to reach a million, ensuring that even in high-risk areas, responsible homeowners have access to protection when disaster strikes.
Universal North America Insurance Company Adopts ZestyAI’s Roof Age Solution
Partnership brings AI-powered verified roof age to strengthen risk decisions and portfolio performance
ZestyAI, the leading provider of AI-powered property and climate risk analytics, today announced that Universal North America Insurance Company, a property insurer, part of the One Alliance Group of companies, has adopted ZestyAI’s Roof Age solution to bring greater accuracy and confidence to property risk assessment across its portfolio.
Why Accurate Roof Age Data Matters
Roof-related claims are among the costliest in property insurance. Yet insurers have long struggled with inconsistent or incomplete roof age data. ZestyAI’s analysis shows that nearly one in three roofs are at least five years older than recorded in policy data, creating blind spots that drive higher losses and mispriced policies.
How ZestyAI’s Roof Age Model Works
ZestyAI’s Roof Age solution closes this gap by synthesizing building permit data with two decades of high-resolution aerial imagery, applying advanced machine learning to deliver verified roof age estimates with 97% U.S. coverage.
Strengthening Portfolio Performance
"Accurate roof data is foundational for managing one of the costliest drivers of property insurance losses,” said Miguel Barrales, President of Universal North America Insurance Company. “ZestyAI’s Roof Age solution provides the reliability we need to make more confident risk decisions and strengthen portfolio performance.”
"For years, insurers have had to make critical decisions without reliable roof data, and the cost has been enormous,” said Attila Toth, Founder and CEO of ZestyAI. “Universal North America Insurance Company’s adoption shows what’s possible when carriers embrace trusted, property-level insights to strengthen their portfolios and the market as a whole.”
ZestyAI Secures Regulatory Approval for Z-WATER™ in Wisconsin
AI-powered model addresses the #1 driver of non-catastrophic property losses, non-weather water
ZestyAI, the leading provider of AI-powered property and climate risk analytics, today announced that its non-weather water risk model, Z-WATER™, has received approval in Wisconsin for use in underwriting and rating.
Why Non-Weather Water Losses Are Rising
Non-weather water is one of the costliest and fastest-growing perils in homeowners insurance, now ranking as the fourth costliest peril overall, with claim severity up 80% over the past decade—surpassing hurricanes. These losses stem from everyday risks like burst pipes, appliance failures, and plumbing leaks. With average claim costs now exceeding $13,000, their financial impact rivals catastrophe events.
How the Z-WATER Model Works
Z-WATER is built, tested, and validated with real insurer loss data, ensuring accuracy and regulatory credibility. The model uses computer vision to analyze aerial imagery alongside tax assessor data, permit records, climatology science, and infrastructure insights to assess key property-level risk factors. By modeling how these variables interact, Z-WATER predicts both the frequency and severity of non-weather water claims with up to 18x greater accuracy than traditional models.
What This Approval Enables for Insurers
With this approval, insurers in Wisconsin can begin using Z-WATER to:
- Set more accurate, property-specific rates
- Align coverage with actual home vulnerabilities
- Optimize inspections and mitigation strategies, such as the adoption of water sensors
- Reduce cross-subsidization and improve portfolio performance
Regulatory Confidence in Explainable AI
“Non-weather water is one of the most frequent and expensive sources of loss for insurers, and it behaves differently than other perils,” said Bryan Rehor, Director of Regulatory Strategy at ZestyAI.
“Z-WATER captures the property-level features that truly drive risk—such as plumbing systems, home design, and even vegetation patterns, giving insurers a much clearer picture of where losses are likely to occur.
"This approval demonstrates that regulators recognize the value of AI models that are explainable, data-driven, and validated against real claims," he added.
Part of a Growing Nationwide Regulatory Track Record
This approval adds to ZestyAI’s growing regulatory momentum. Across five perils, including wildfire, hail, wind, storm, and now non-weather water, ZestyAI has secured more than 70 approvals coast-to-coast.
In addition to these peril models, ZestyAI’s Z-PROPERTY™ solution has also earned nationwide approvals, giving insurers trusted roof and parcel-level insights with the same regulatory credibility.
Southern Oak Deploys ZestyAI’s Risk Platform to Improve Risk Visibility and Reduce Losses in Florida
Granular insights into roof and parcel-level risk help reduce storm losses and strengthen portfolio performance across Florida’s high-risk market
Southern Oak Insurance Company, a Florida-based insurer specializing in personal residential property coverage, has adopted ZestyAI’s AI-powered property risk platform to improve visibility into property condition and exposure across its homeowners portfolio.
By analyzing structural and environmental vulnerabilities, such as roof degradation, overhanging vegetation, yard debris, and secondary structures, ZestyAI’s platform equips Southern Oak to take targeted actions that help reduce losses and manage exposure more effectively. These granular, property-level insights also offer a clearer view of changing risk conditions across one of the most challenging insurance markets in the country.
Southern Oak is leveraging two core capabilities within ZestyAI’s Z-PROPERTY solution:
- Digital Roof applies AI to high-resolution aerial imagery to assess roof complexity, materials, and condition, flagging structural vulnerabilities before they become claims.
- Location Insights evaluates the broader parcel to surface risk factors such as vegetation overhang, yard debris, and secondary structures that can amplify storm losses or drive claim severity.
“ZestyAI stood out for its ability to provide deep, 3D visibility into the condition and complexity of the properties we insure.”
“ZestyAI stood out for its ability to provide deep, 3D visibility into the condition and complexity of the properties we insure,” said Tony Loughman, CEO of Southern Oak Insurance Company. “These insights help us improve our risk decisions and manage exposure more effectively across a high-risk geography, while continuing to deliver value and stability to our policyholders.”
“Southern Oak is taking a proactive, data-driven approach to strengthen portfolio decisions,” said Attila Toth, Founder and CEO of ZestyAI. “In Florida’s uniquely challenging insurance market, resilience depends on seeing risk clearly at the property level—and acting on it.”

Mitigation Aware Scoring for Severe Convective Storm Risk
Changes such as upgrading or replacing roofs and addressing structural deficiencies will automatically influence risk scores
ZestyAI today announced a new enhancement to its Severe Convective Storm (SCS) risk suite that enables carriers to adjust model inputs and risk scores based on mitigation efforts.
The enhancement gives insurers a structured and scalable way to reflect real-world improvements, such as upgrading roof materials, replacing aging roofs, or addressing structural deficiencies, directly within property-level risk assessments.
What the New Capability Enables
Carriers can now instantly update risk scores based on verified property data, enabling three key use cases:
- Reflecting completed mitigation: Recognize risk-reducing actions like roof upgrades or structural improvements in real time, improving rating accuracy and customer satisfaction.
- Correcting inaccurate data: If errors are identified, such as incorrect roof material, carriers can transparently correct inputs to ensure fairer, more accurate risk assessments.
- Simulating future changes: Carriers can model the potential impact of proposed upgrades before they occur, helping agents and homeowners understand the value of mitigation and reinforcing behavior that reduces future losses.
Why It Matters for Carriers and Policyholders
Kumar Dhuvur, Co-Founder and Chief Product Officer of ZestyAI, said:
“Models should be powerful, but also flexible and responsive to real-world improvements.”
“By giving carriers the ability to incorporate mitigation and field data into model outputs, we’re supporting transparent, action-oriented risk management that benefits both insurers and homeowners.”
This mitigation-aware functionality is already in use across ZestyAI’s wildfire products, including Z-FIRE™ and Compliance Pre-Fill, where it supports critical regulatory filings and enables carriers to reflect mitigation actions like defensible space and Class A roofs. Extending this capability to the SCS suite ensures a consistent, carrier-controlled approach to incorporating verified improvements across perils.
Built for Transparency and Human-in-the-Loop Decisioning
This enhancement reflects ZestyAI’s broader commitment to human-in-the-loop AI, where insurers remain in control of key decisions and have visibility into the data behind every score.
By combining transparency with the ability to incorporate verified updates, ZestyAI helps carriers build trust with both regulators and policyholders while ensuring model outputs remain grounded in real-world conditions.
The score adjustment capability is seamlessly integrated into the ZestyAI platform and supports a wide range of use cases, including improving product fit, optimizing inspection workflows, enhancing underwriting decisions, and ensuring rating accuracy.
The Z-HAIL™, Z-WIND™, and Z-STORM™ models are built on real-world claims data and leverage property-specific features such as roof geometry, condition, and vegetation to deliver more accurate risk insights than traditional territory-based models.
ZestyAI’s storm models are approved for use in over 20 states across the Great Plains, Midwest, and U.S. South, regions most impacted by severe convective storms, and are actively used by carriers for rating and underwriting.

Steadily Selects ZestyAI to Strengthen Underwriting for Landlord Insurance
Top-rated insurer deepens partnership with ZestyAI to strengthen landlord underwriting with parcel-level hail and wind insights
ZestyAI today announced an expanded partnership with Steadily, a top-rated insurer for rental properties, to deliver advanced hail and wind risk models that enable more precise underwriting. Building on a successful rollout in 2024, Steadily is broadening its use of ZestyAI’s property-specific insights to better assess storm risk and support growth across high-exposure states.
With operations in all 50 states and $300 million in annualized gross written premium, Steadily is one of the fastest-growing insurers in the U.S.
Steadily first adopted ZestyAI’s Z-HAIL™ and Z-WIND™ models in four high SCS states. With a successful proof of concept, the company is now extending usage to additional states in the coming months.
Datha Santomieri, Co‑Founder & COO of Steadily, said:
“Expanding our use of ZestyAI’s hail and wind models reaffirms our commitment to precision and efficiency in landlord underwriting. These insights help us make informed decisions quickly and manage exposure with greater confidence.”
ZestyAI’s platform predicts the likelihood and severity of storm-related claims by analyzing how localized climatology interacts with individual property characteristics — a sharp contrast to traditional models that rely on ZIP code or territory-level assessments. Each model is built and validated on extensive real-world claims data and delivers transparent explanations of the key factors behind every risk score.
Together, Z-HAIL and Z-WIND help insurers identify storm risk at the parcel level by evaluating roof condition, structural complexity, historical losses, and local storm exposure, enabling the granularity needed to underwrite confidently in volatile regions.
“Steadily is modernizing a critical segment of the market with their customer-centric, tech-forward approach,” said Attila Toth, Founder and CEO of ZestyAI.
“We’re proud to support their growth with AI-driven insights that enable better pricing, smarter underwriting, and more resilient portfolios.”
ZestyAI’s severe convective storm models are currently approved by regulators in 19 states and used by leading insurers across the country.

Enterprise Data Quality: The Hidden Risk in Insurance
In insurance, data is destiny. The problem is that most carriers don’t actually trust the data they’re working with.
After years of working with leading insurers, one reality has become undeniable: enterprise data quality is one of the biggest hidden risks in the industry.
The Problem: Carriers Don’t Trust Their Own Data
Data enters the system at the quote stage. That means it often comes directly from agents and policyholders—well-intentioned, but subjective. Did the policyholder really know the exact roof age? Did the agent catch the secondary structures in the backyard?
Inspection resources are limited, and most carriers can’t validate this information at scale. The result is a house of cards: data that looks complete in the policy system, but is riddled with blind spots and inconsistencies.
And even when the data is accurate in the moment, it quickly decays. Structures are living assets, meaning:
- Roofs degrade.
- Weather events roll through.
- Families expand, renovate, and change how they use the property.
- Secondary structures, pools, trampolines, and solar panels appear overnight.
The underwriting file that was “clean” at binding can be outdated and incomplete by renewal. Over time, carriers lose confidence that they have a real view of risk.
The Six Dimensions of Data Quality
Data quality isn’t one thing—it’s multidimensional. For carriers, the challenge is ensuring property data is:
- Accurate: Correct at the point of use, not just at intake.
- Complete (and unbiased): Captures all risk-relevant details, verified against independent sources so fields aren’t left blank, misstated, or skewed by incentives.
- Consistent: Aligned across systems, from quoting to claims.
- Valid: Structured to meet business and regulatory rules.
- Timely: Refreshed when things change, not years later.
- Unique: De-duplicated, with a single source of truth.
By this standard, most carrier data today is falling short.
From Data Quality to Data Integrity
Data quality is foundational, but it’s only part of the picture. True data integrity comes from combining accurate data with the right context and continuous observability.
That means not just having the right roof age or square footage, but knowing whether that data has changed, and whether it aligns with other signals in the environment. It means having a complete, transparent, and continuously updated picture of every property.
The ZestyAI Solution: Verified, Transparent Property Data
At ZestyAI, we built our property intelligence platform to solve exactly this problem. By unifying multiple independent data streams—and applying AI to synthesize them—we deliver property data that carriers can trust.
Here’s how we do it:
Imagery + Computer Vision
We ingest aerial, satellite, and terrestrial imagery, then apply over 90 proprietary computer vision models. These models don’t just “see” a property; they interpret it. That means extracting hard-to-get details like:
- Roof condition and penetrations
- Yard debris and overhanging vegetation
- Secondary structures and solar panels
This creates a dynamic, objective record of what’s on the ground, property by property.
Geospatial and Hazard Data
Context matters. We overlay geospatial layers to understand how a property interacts with its environment, including wildfire exposure, flood risk, and more.
Building Permits
Using large language models (LLMs), we extract and synthesize the real changes reflected in building permits: bathrooms added, kitchens renovated, roof replacements, solar installations. Permits reveal what’s changed, not just what was once approved.
Market and Public Records
We enrich the picture with MLS transactions, tax assessments, climatology, topography, and infrastructure data. Together, these data sources confirm and contextualize what imagery and permits reveal.
Standards and Designations
We integrate authoritative designations, such as IBHS Fortified™ standards, to validate resilience features.
Each data source adds a layer of verification. Together, they create a comprehensive, continuously updated property record that carriers can rely on.
Why This Matters: Enterprise Data Quality Transformed
When carriers bring ZestyAI data into their systems, the impact is immediate:
- More Accurate Underwriting and Rating: Quote data is validated against independent sources. That means fewer surprises at claim time, more consistent rating, and appropriate premiums.
- Change Detection and Accurate Renewals: Our models detect what’s changed since policy inception, leading to smarter renewal decisions, more proactive outreach to policyholders, and reduced leakage.
- Better Reinsurance Negotiations: Clean, transparent data helps carriers secure the right terms, conditions, and pricing from reinsurers—because they can prove their book is based on verified risk, not guesswork.
- Operational Efficiency: By replacing guesswork and manual inspection with AI-verified data, carriers reduce expenses and focus resources where they matter most.
- More Accurate Customer Communications: Data quality isn’t just about pricing and underwriting. It’s about trust. Verified property details enable carriers to send personalized, timely, and accurate communications.
- Renewal notices, policy updates, or even hurricane prep guidance land with credibility because they reflect the customer’s real property. That strengthens engagement, reduces confusion, and builds long-term retention.
The Bottom Line
Carriers can’t compete in today’s market with messy, decaying data. Enterprise data quality is no longer a “back office” concern. It’s a competitive edge.
ZestyAI’s property intelligence platform solves the problem at its core: by continuously verifying property data with imagery, geospatial science, permits, and AI-powered interpretation.
That’s how carriers build trust in their data. That’s how they write better risks, renew smarter, negotiate stronger, and communicate with customers more effectively.
Want to see how ZestyAI can transform your enterprise data quality? Contact us for a demo.
See How Insights Turn Into Decisions
ZestyAI transforms data into action. Get a demo to see how the same AI powering our reports helps carriers make faster, smarter, regulator-ready decisions.