Reports & Research
Explore proprietary research packed with data, insights, and real-world findings to help carriers make smarter decisions.
.png)
ZestyAI Publishes Data-Driven Look at 2022 Wildfire Season
2022 Wildfire Season Overview looks back at 2021 and ahead to what may be a long year of wildfires in 2022.
Today, ZestyAI released its 2022 Wildfire Season Overview. Each year, ZestyAI prepares a comprehensive overview to help guide insurers based on recent wildfire events, persistent drought conditions, and advancements in artificial intelligence for managing wildfire risk.
If it seems like wildfires are burning at all times of the year, it's not just you. Very destructive events, like last December's Marshall Fire, are occurring in months not typically associated with high wildfire danger. Those who study wildfires, including ZestyAI, have begun to start thinking in wildfire "years" instead of wildfire "seasons'. Strong wildfire years, with 10+ million acres burned, have quickly become the new normal. The last 10 years have been the worst on record for property and casualty (P&C) insurers when it comes to wildfire. 8 of the top 20 fires in California history, and more than half of the acreage burned by them, occurred in just the years 2020 and 2021.
What can insurers do to prepare themselves for persistent wildfires?
- Understand the Data: Instead of sticking with decades-old approaches, assess wildfire risk at the property level.
- Continue to Bring Transparency and Education to Homeowners: Insights from AI-based wildfire risk models may be passed on to homeowners and agents, enabling a much better understanding of wildfire risk.
- Find the Right Technology Partner: Aerial and satellite imagery, machine learning, and infinitely scalable cloud computing resources were combined to build the most granular wildfire risk assessment model (Z-FIRE™). Using Z-FIRE™, ZestyAI can accurately estimate an individual property’s wildfire risk, plus highlight the key property-level factors that contribute to that risk.
Click here to download ZestyAI's 2022 Wildfire Season Overview.
ZestyAI offers insurers and real estate companies access to precise intelligence about every property in North America. The company uses AI, including computer vision, to build a digital twin for every building in North America, encompassing 200B property insights accounting for all details that could impact a property’s value and associated risks, including the potential impact of natural disasters. Visit https://zesty.ai for more information.
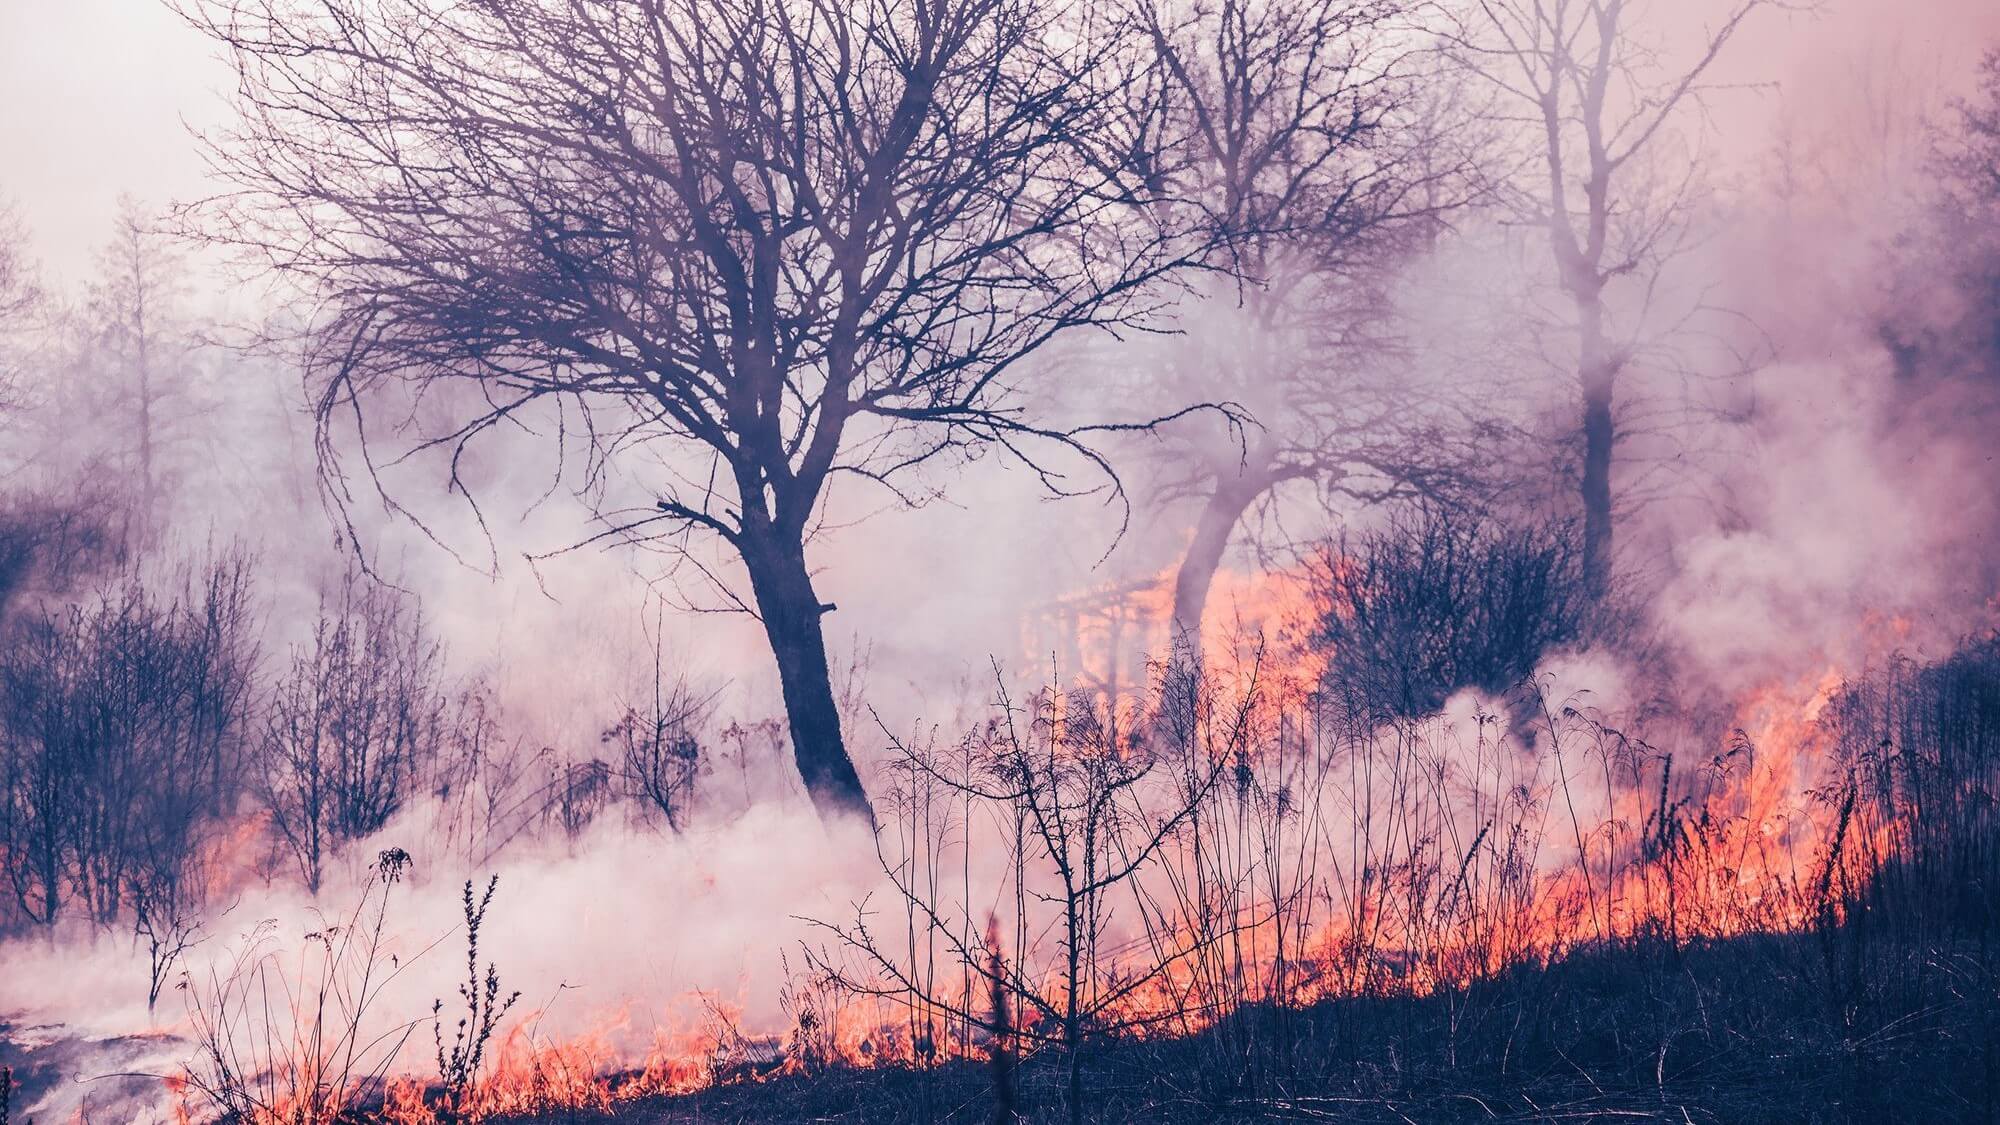
The 2021 Wildfire Season has Devastating Potential
A Data-Driven Conversation about the US West’s Megadrought
Current climate conditions in the West reveal that 2021 may have a higher than normal risk for wildfire losses. While much of this report focuses on California, historically the worst victim of wildfire in the US, the entire western US is of concern in 2021. In particular, the expansion of deep drought into Colorado is of major concern.
Drought is a leading factor in seasonal wildfire risk. With drought extending through every western state this spring, insurers should consider looking deeply into how they are addressing this growing peril. According to AON, last year’s wildfires in the US West cost insurers over $8 billion.
We've released a complete detailing the devastating potential for 2021's wildfire season. The full report is available here.
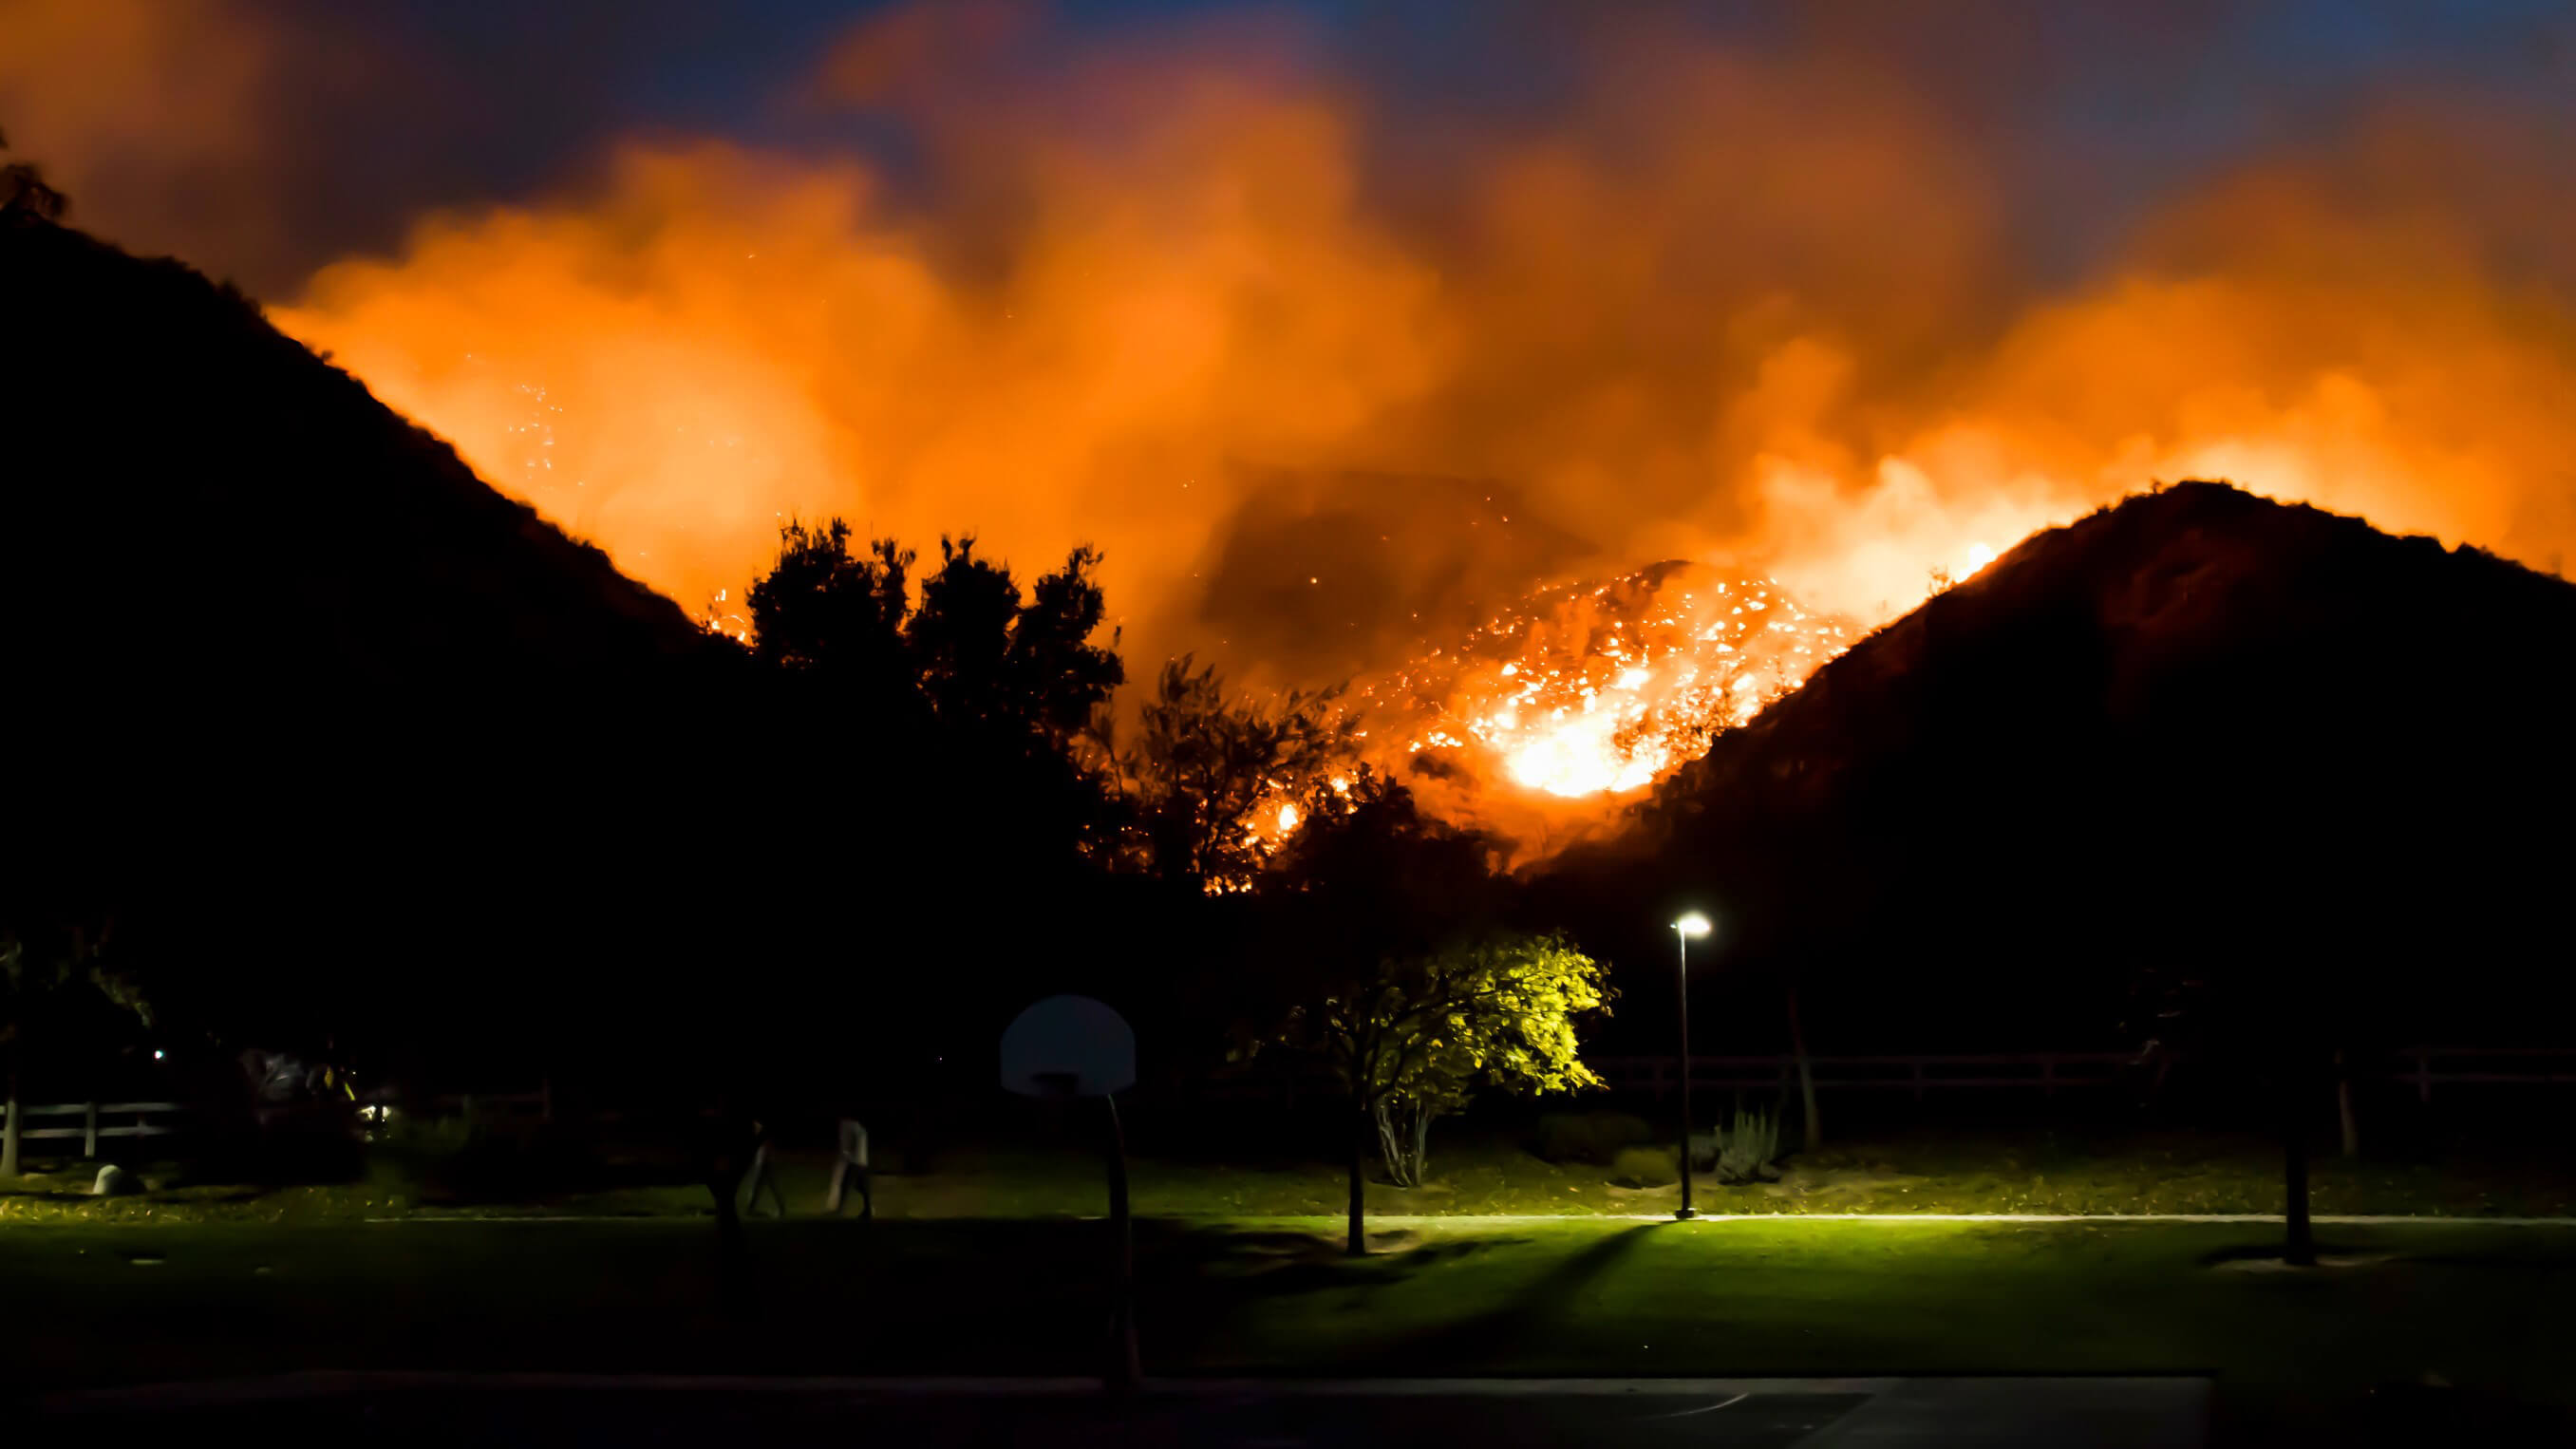
Nearly Doubling a Property’s Wildfire Survival Rate: New Study from ZestyAI in Collaboration with IBHS Shows Impact of Key Mitigation Action
Research across more than 71,000 properties involved in wildfires draws significant links between fuel management and property survival.
Oakland,Calif., April 8, 2021: ZestyAI, a leader in climate risk analytics powered by Artificial Intelligence (AI), and the Insurance Institute for Business & Home Safety (IBHS) today released new research on how fuel management impacts destruction rates from wildfires. They found property owners who clear vegetation from the perimeter of their home or building can nearly double their structure's likelihood of surviving a wildfire.
ZestyAI, in conjunction with, IBHS studied more than 71,000 properties involved in wildfires between 2016 and 2019 to assess the relationship between vegetation, buildings, and property vulnerability. To do this, ZestyAI leveraged a combination of computer vision and AI to analyze high resolution satellite and aerial imagery of the properties that fell within the wildfire perimeter, which allowed them to determine what effects a property's physical environment had on its likelihood of survival. They found buildings with a high amount of vegetation within 5 feet of the structure were destroyed in a wildfire 78 percent of the time -- a rate nearly twice as high as those with small amounts of perimeter vegetation. This pattern held true as ZestyAI analyzed the other defensible zones, ranging from 30 to 100 feet around the property.
"It's common sense that increased vegetation increases wildfire risk, but this study shows just how powerful individual action can be in safeguarding structures. Mitigation actions that can cut risk nearly in half are statistically meaningful to anyone with a stake in this peril," said Attila Toth, CEO of ZestyAI. "These findings also underscore how wildfire research at IBHS and artificial intelligence at ZestyAI translates to real-world impact at the intersection of homeowners, community leaders, regulators, and insurance carriers. This type of collective action will help protect our communities from the devastating impact of wildfire, which unfortunately has continued to increase over the last decade."
The study also supported and confirmed takeaways from IBHS's Suburban Wildfire Adaptation Roadmaps released last year, which go beyond the home ignition zone to detail additional actions needed across eight aspects of a home to address a home's wildfire vulnerability. ZestyAI's new research found that having other structures in close proximity to a property increases its wildfire risk, particularly for properties in areas with moderate to high vegetation coverage. Buildings in these areas that had another structure within 30 to 100 feet from the property were destroyed in a wildfire 60 percent of the time, compared to a 31 percent destruction rate for homes without another structure in close proximity.
"This research further demonstrates to homeowners, community leaders, and policy makers just how impactful taking the mitigation actions laid out in the Suburban Wildfire Adaptation Roadmaps can be in protecting homes from wildfire ignition," said Roy E. Wright, President & Chief Executive Officer at IBHS. "Quantifying the effect of mitigating fuel density risk, one of the critical actions identified in the Roadmaps, is a first piece in the larger puzzle of what groups of mitigation actions most improve the chance of home survival and by what level."
ZestyAI is uniquely equipped to support this type of research because of the proprietary wildfire property loss database it developed for Z-FIRE™, its AI model that generates property-specific predictive risk scores. Z-FIRE™ has been trained on more than 1,200 wildfire events across several decades and accounts for the property-level factors that contribute to wildfire risk, including defensible space, building material, and roof pitch, which legacy models fail to consider.
Wright added, "While it is not possible to eliminate wildfire risk we are not powerless against it. We must take a pragmatic approach to mitigate risk at all levels and ultimately reduce property damage through data and science. Through collaborations with modelling organizations like ZestyAI, advanced technology like computer vision and AI help us better understand the impact of these actions at a larger scale. It is encouraging to see emerging progress in just the first months of 2021."
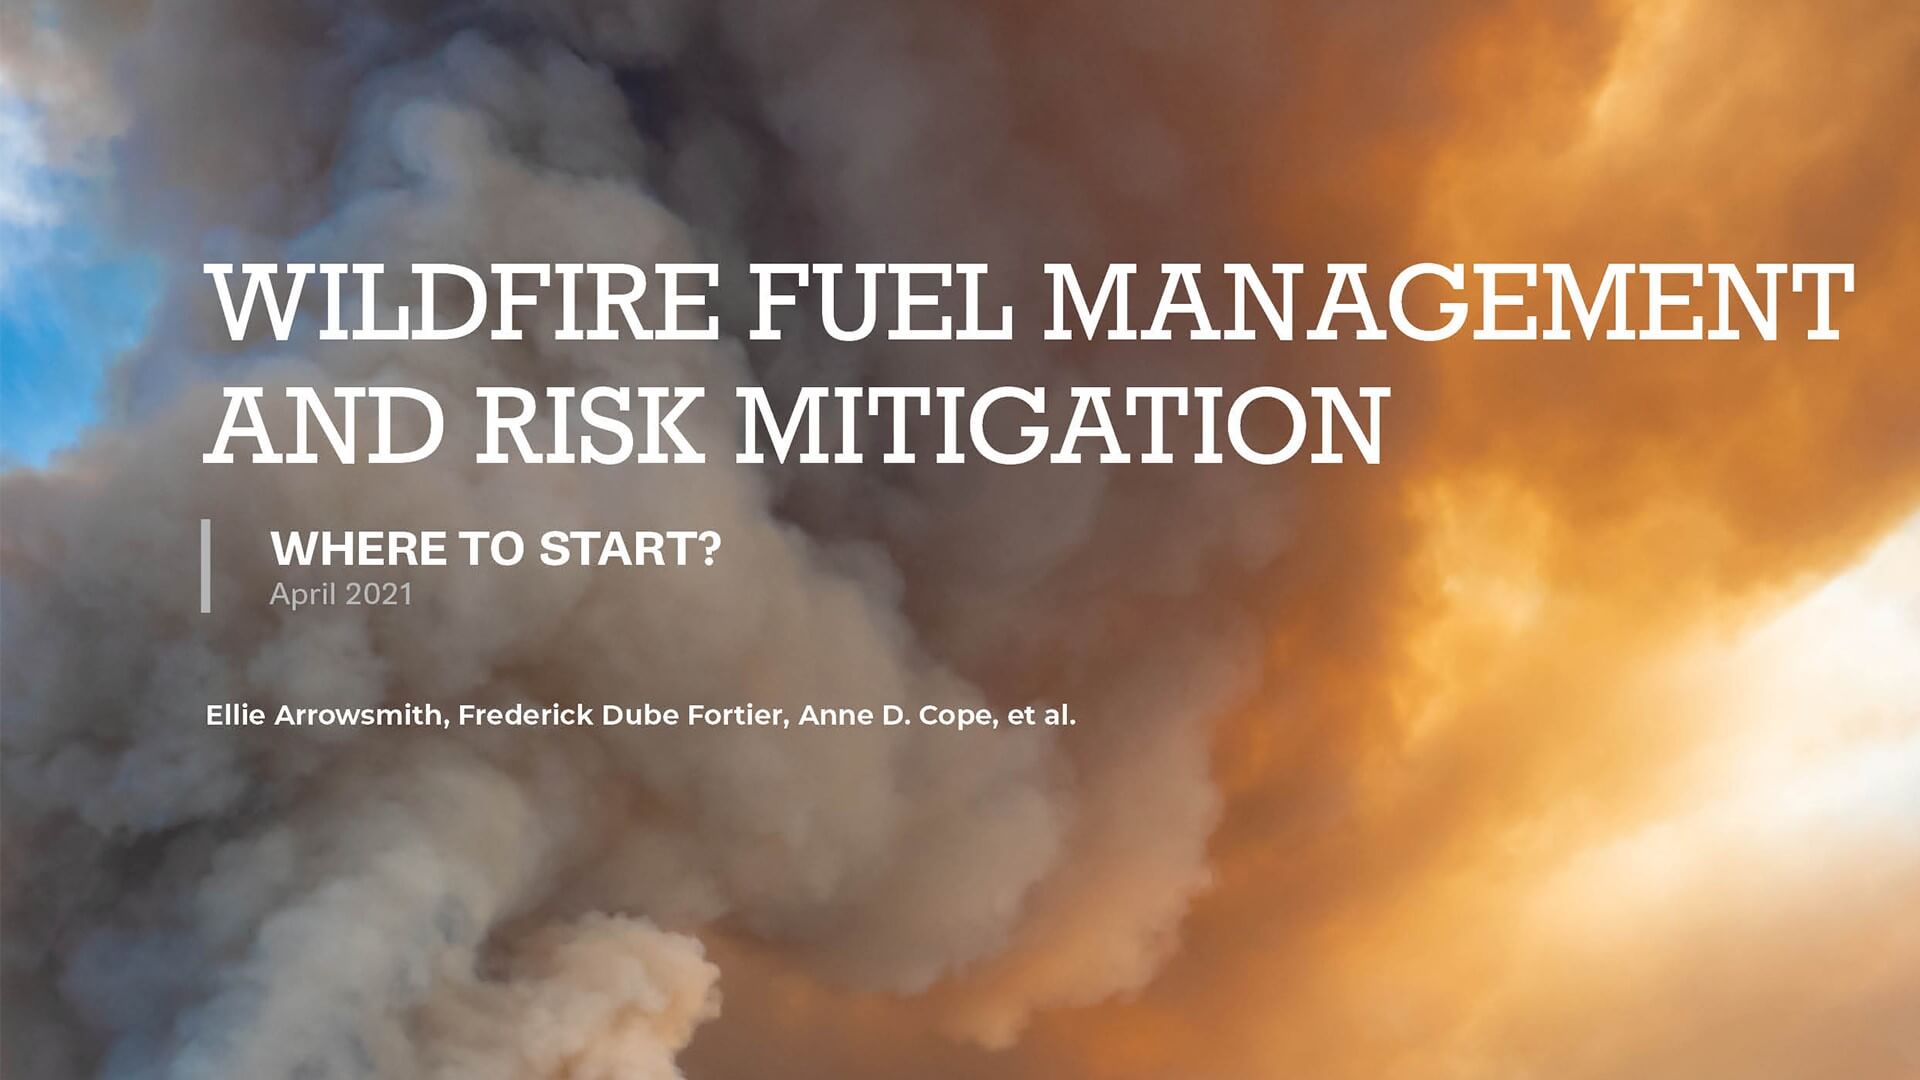
For additional insights you can read the full research paper, ‘Wildfire Fuel Management and Risk Mitigation - Where to Start?' here. For more information on ZestyAI please visit www.zesty.ai, and for more information on IBHS please visit www.ibhs.org.
About ZestyAI (www.zesty.ai): Increasingly frequent natural disasters, such as wildfires, floods and hurricanes devastated communities and drove $2.2 Trillion in economic losses over the past decade. ZestyAI uses 200Bn data points, including aerial imagery, and artificial intelligence to assess the impact of climate change one building at a time. ZestyAI has partnered with leading insurance companies and property owners helping them protect homes, businesses and support thriving communities. ZestyAI was named Top 100 Most Innovative AI Company in the world by CB Insights in 2020, and Gartner Cool Vendor in Insurance by Gartner Research in 2019. For more information visit: https://www.zesty.ai/
About the Insurance Institute for Business & Home Safety (IBHS)
The IBHS mission is to conduct objective, scientific research to identify and promote effective actions that strengthen homes, businesses and communities against natural disasters and other causes of loss. Learn more about IBHS at DisasterSafety.org.
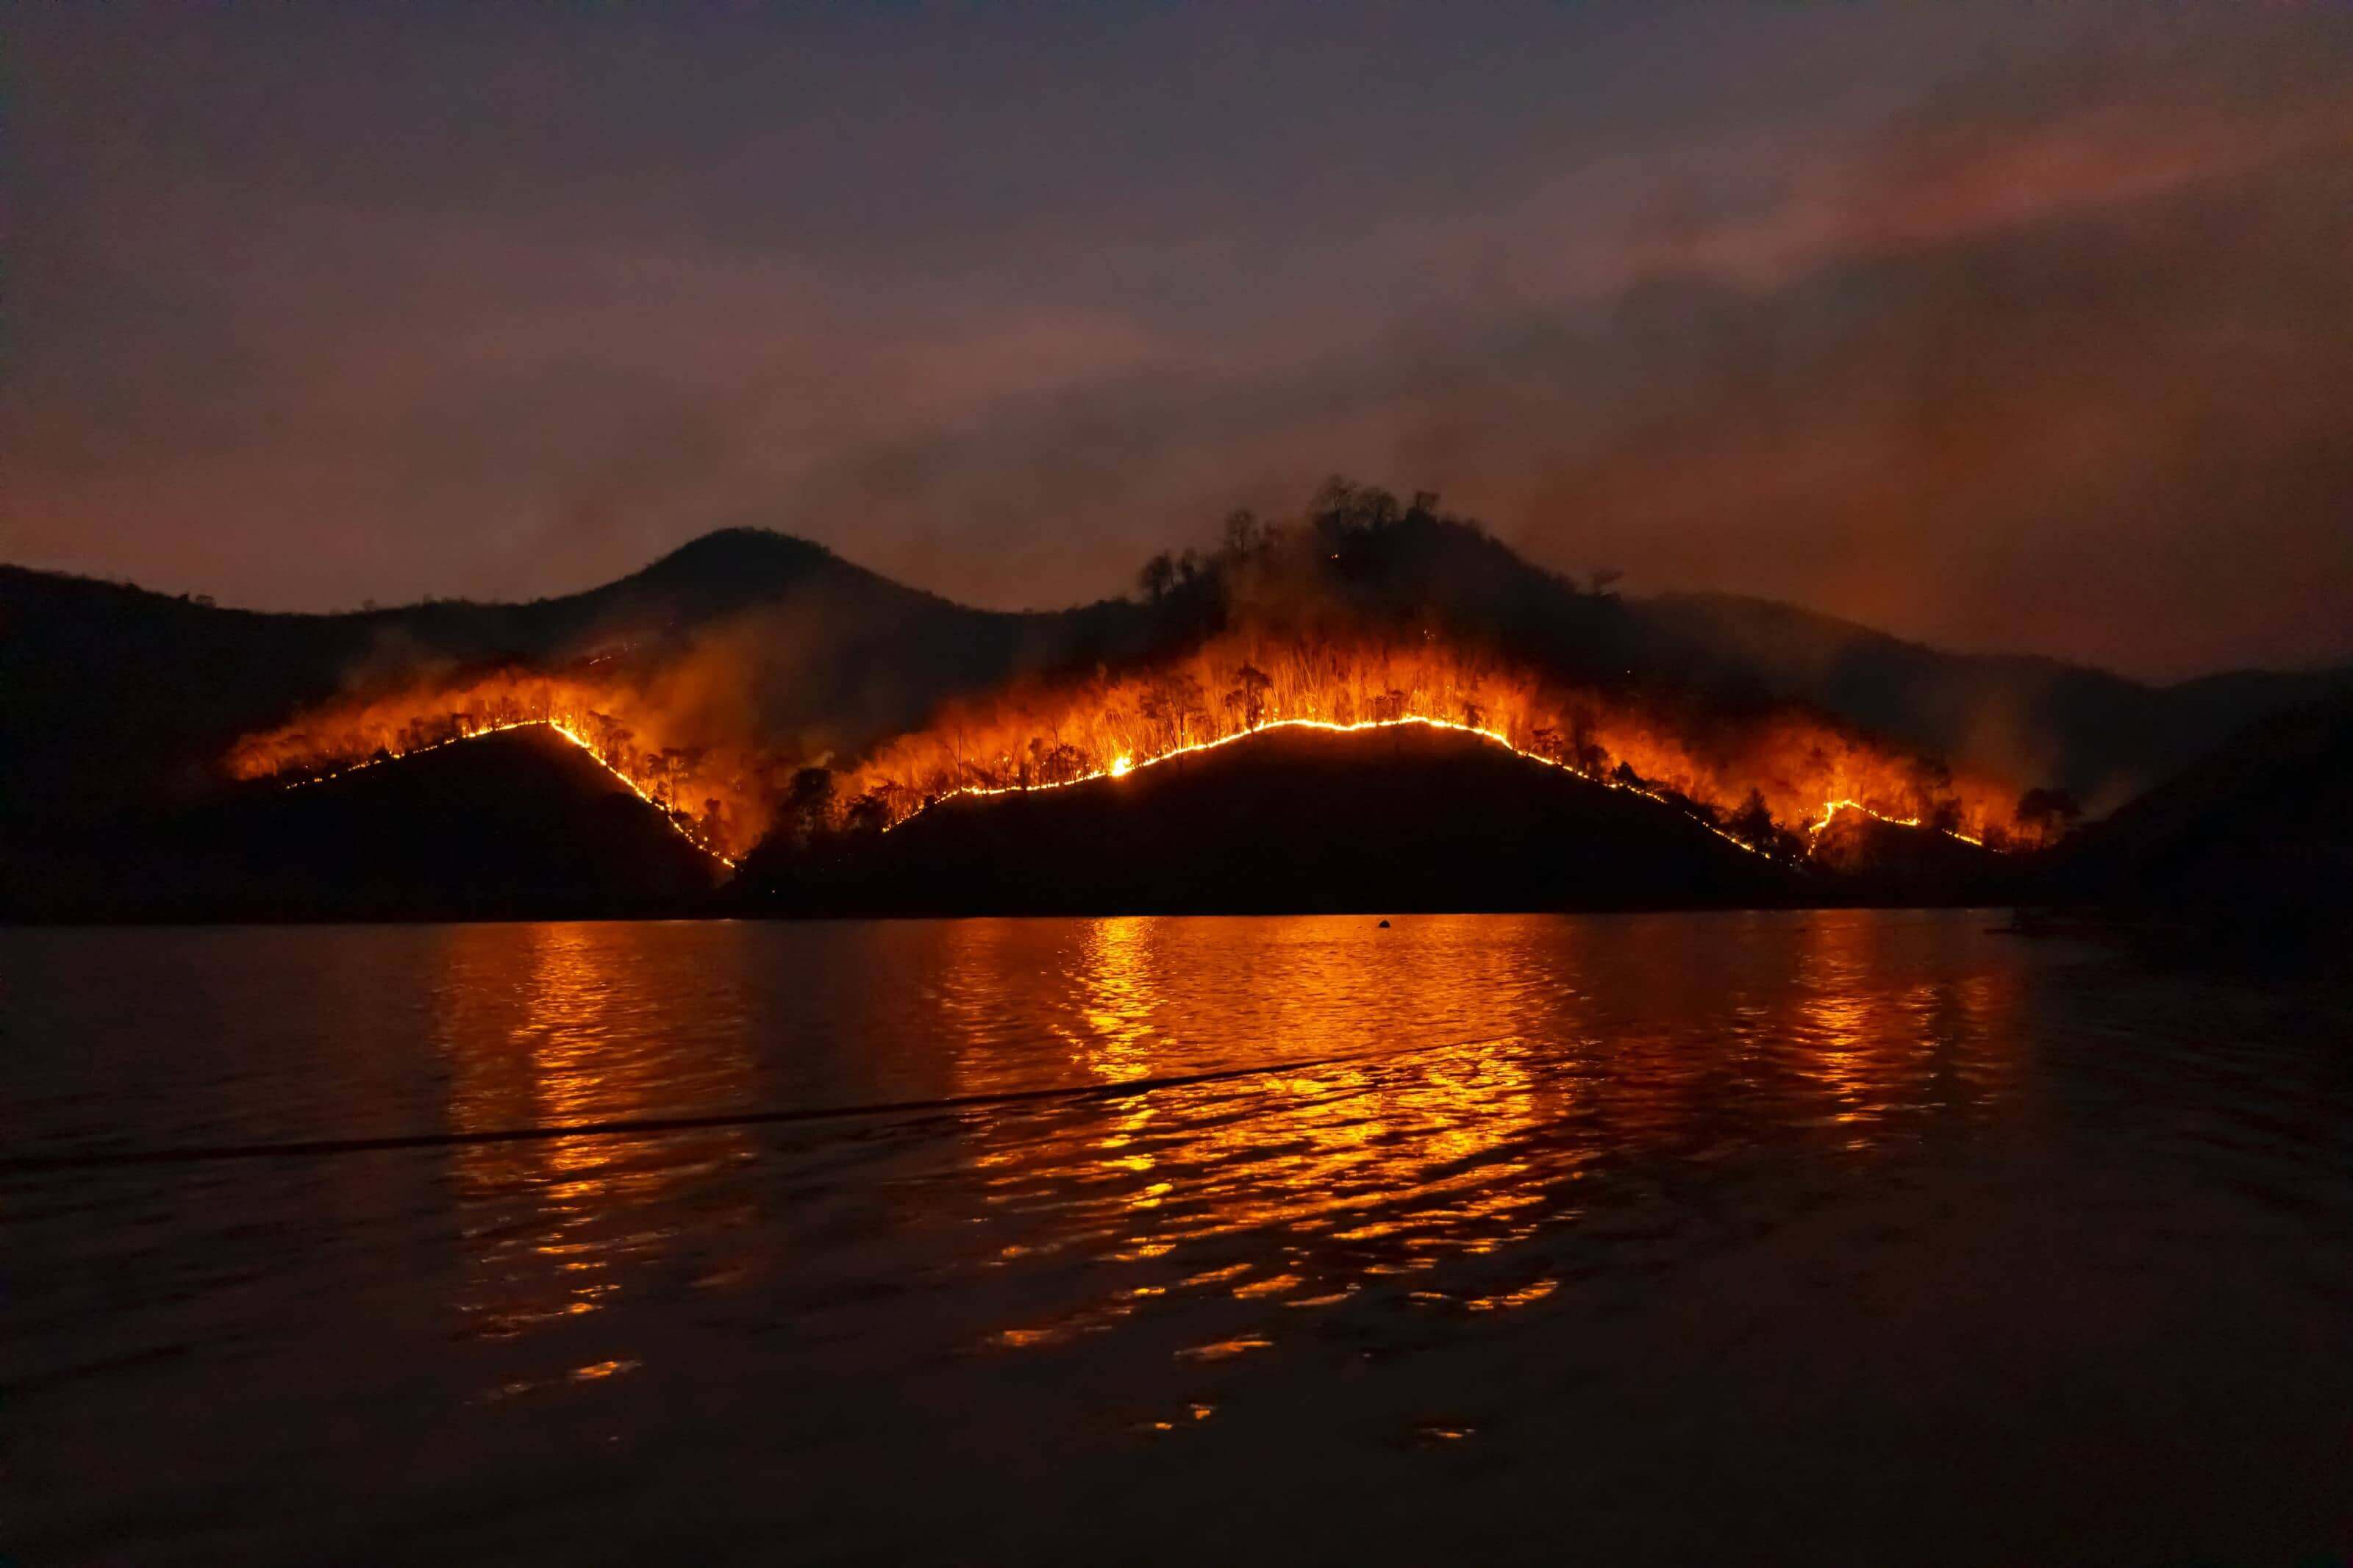
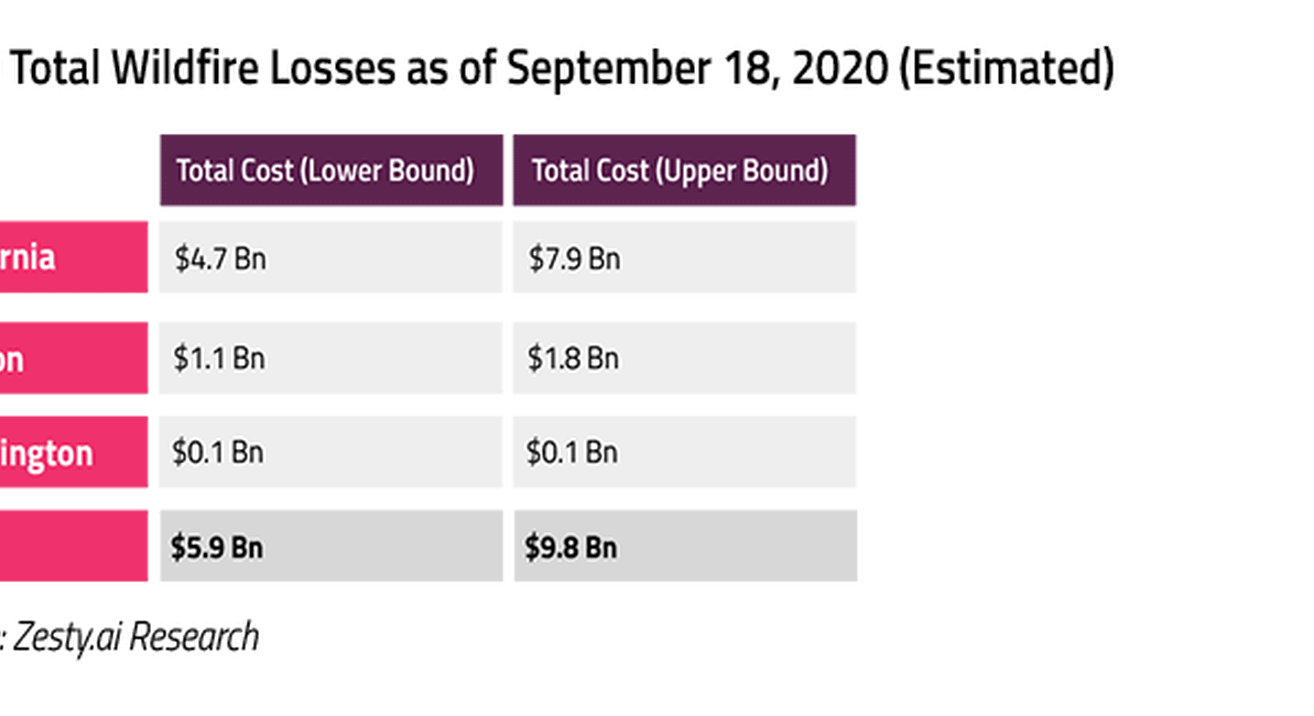
ZestyAI Research: Up to $9.8Bn in Losses Already Caused by Wildfires in 2020
As of September 18th, between $5.9Bn and $9.8Bn in losses have occurred this year alone.
The Zest
ZestyAI has been keeping a close eye on the wildfires burning in the Western United States. Whether by evacuation or smoke, most of our employees have felt the impact firsthand.
Utilizing our vast wildfire data and artificial intelligence resources, we have estimated that as of September 18th, between $5.9Bn and $9.8Bn in losses have occurred this year alone.
What has made 2020 unique?
Two key aspects have made the 2020 Wildfire Season exceptional: the number of acres burned and the timing of the fires.
2018, which previously held the California record for acres burned at 1,975,086 has been eclipsed with months left in the seasons. More than 3.3 million acres have already been charred by wildfire this year in California alone, and more than 5 million in the Western US.
Fire season tends to start in September and peak in November. In August, a large scale lightning event occurred, triggering many of the California wildfires. Oregon, which typically has a shorter wildfire season has also seen early and widespread wildfires.
Analysis Methodology
Using ZestyAI’s comprehensive historical wildfire loss data, up-to-date wildfire perimeter locations for the 2020 season, residential and commercial property information, and fueled by ZestyAI’s AI-driven wildfire damage risk scores, the expected destruction and cost of the 2020 wildfire season so far was calculated for California, Oregon, and Washington.
To estimate the destruction and damages, ZestyAI identified every structure involved in the 2020 wildfire perimeters and their associated wildfire vulnerabilities. Using the historical relationship between the risk profile of the structure, asset value, and economic loss, ZestyAI was able to estimate the full economic loss of those events (including non-insured assets such as uninsured property, and non-insured economic cost). Actual information from CalFire on CZU and LNU incident was used to validate the methodology.
From our extensive historical loss data, a relationship between structural damage expected and the cost of wildfire events was developed based on local property and loss information and expanded to include additional considerations such as smoke damage, displacement costs, and construction.
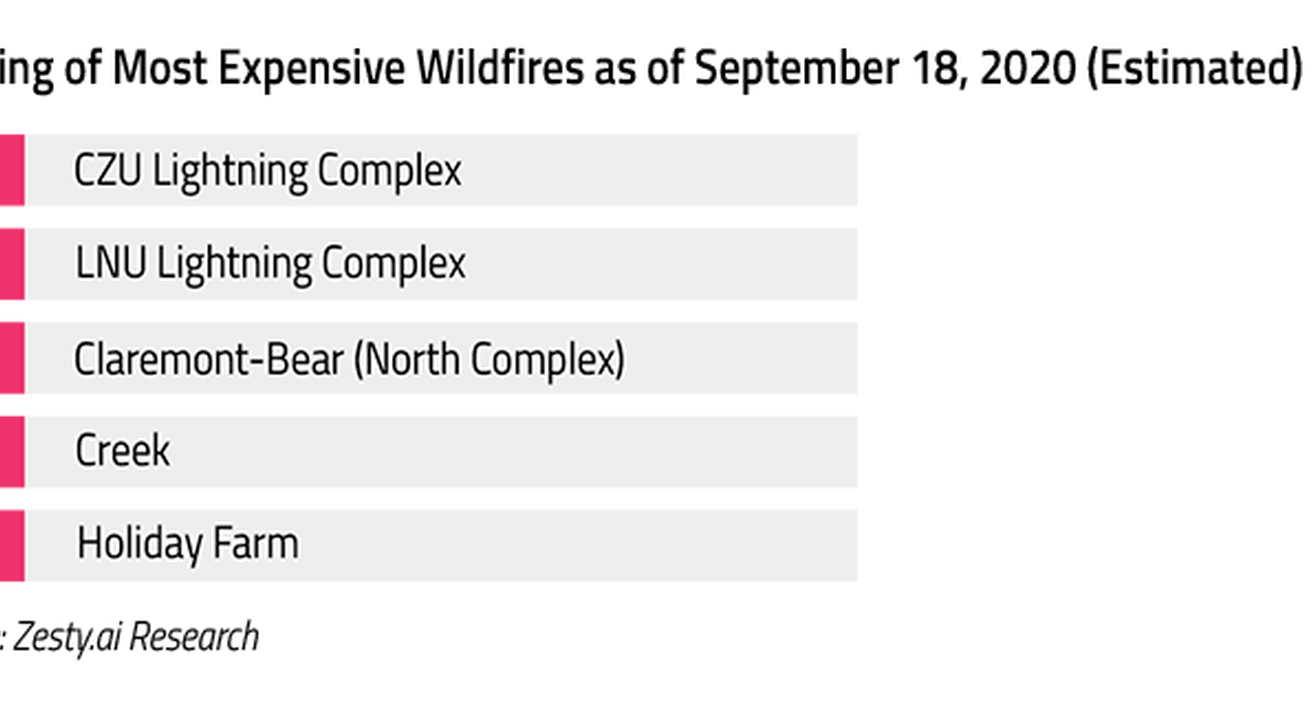
The 5 Most Destructive Fires So Far
Our estimates place the Claremont-Bear (North Complex) at the top of the list of most destructive in terms of number of properties lost. Four of these five wildfires occurred in California with the Alameda Drive fire occurring in Oregon.

The 5 Most Expensive Fires So Far
While the Claremont-Bear (North Complex) fire is estimated to have destroyed the most properties, the CZU Lightning Complex fire is currently estimated to be the most costly at up to $2.6B. That makes it responsible for ~27% of all total economic losses from fires in the 2020 season so far.
Putting Numbers on Destruction
By ZestyAI estimates, between $5.9Bn and $9.8Bn of economic losses have occurred in California, Oregon, and Washington so far this year. California, which also leads in acres burned (5M+) makes up the lion’s share at up to $7.9B.
It’s important to state that the fire season is not yet over. In much of the Western US, it could be just beginning. With a number of fires still active and the potential for more to start, these numbers are almost certain to rise between now and the end of the year.
Looking Forward
Multiple estimates place the 2018 wildfire season at around $15Bn in total losses. While exceptional in terms of total acres burned, the 2020 wildfire season has not yet reached that level of economic loss. Without any doubt, this will be one of the costliest years on record, and with months left in the season, the potential exists for this year to surpass 2018 if it continues at its current pace.
ZestyAI will continue to monitor this fire season. As in years past, new data continues to refine our models and analyses. Insurance professionals and media who would like more information about this analysis or about how artificial intelligence can help insurers protect themselves and their customers from wildfire should contact us.
DUAL Strengthens Storm Risk Underwriting and Rating With ZestyAI
ZestyAI’s Z-STORM™ delivers property-level predictions into hail and wind risk to support rapid U.S. expansion
DUAL North America Inc.’s (“DUAL”) personal property division has selected ZestyAI’s Z-STORM™ model to enhance storm-risk underwriting and pricing as it continues its rapid US expansion.
The partnership equips DUAL with sharper risk differentiation, more accurate underwriting and pricing, and a stronger foundation for sustainable growth in regions increasingly affected by severe convective storms.
By adopting ZestyAI’s severe convective storm model, DUAL will strengthen its ability to identify and price the combined effects of hail and wind with greater precision. This will enable faster, more informed decisions and profitable expansion while maintaining regulatory compliance.
The collaboration reflects DUAL’s continued investment in advanced analytics and technology to support long-term growth.
The specialty program administrator, offering more than 40 insurance products and surpassing $1.3 billion in gross written premium in 2024, continues to broaden its capabilities across commercial, specialty, and personal lines.
Luke Wolmer, Chief Actuary at DUAL, said:
“As we continue to grow across personal property lines, having accurate risk prediction at the property level is crucial."
Z-STORM gives us a more nuanced understanding of storm vulnerability, helping us recognize differences in risk that traditional models overlook. This enhances our team’s confidence in pricing decisions and will support our continued expansion across the U.S.”
Z-STORM is an AI-powered risk model that evaluates the combined effects of hail and wind to predict the frequency and severity of storm-related damage at the property level. By analyzing the interaction between local climatology and the unique characteristics of every structure—including roof condition, material, and surrounding exposure—the model delivers precise, property-specific insights into storm vulnerability.
In September 2025, ZestyAI introduced mitigation-aware scoring to its severe convective storm suite, allowing insurers to dynamically adjust risk scores to reflect verified improvements such as roof replacements, upgraded materials, or corrected property data. This enhancement gives carriers a scalable way to recognize mitigation within pricing and underwriting workflows, advancing transparency and regulatory alignment.
Attila Toth, Founder and CEO of ZestyAI, said:
“DUAL’s adoption of Z-STORM reflects a forward-thinking approach to storm risk management."
"By applying property-level risk analytics and mitigation-aware scoring, DUAL is positioned to underwrite more precisely, grow responsibly, and strengthen community resilience across the regions that are most exposed to extreme weather”.
ZestyAI’s storm models are regulatory reviewed and ready to use across the Great Plains, Midwest, and U.S. South, regions most impacted by severe convective storms, and are actively used by carriers for rating and underwriting.

ZestyAI Expands Agentic AI Platform Across All P&C Lines
ZestyAI today announced the expansion of ZORRO Discover™ to all property and casualty insurance lines.
ZORRO Discover analyzes millions of state filings to surface real-time regulatory and market intelligence, giving carriers actionable insights to make faster, more confident decisions. Carriers using the platform have reduced adverse selection, accelerated regulatory approvals by up to 50%, and expanded analytical capacity more than 20-fold—turning what was once a manual, fragmented process into a source of strategic advantage.
The platform now delivers unified visibility across all P&C lines, including Commercial Auto and Property, Personal Auto and Property, Financial and Specialty Lines, Liability and Professional Lines, Workers’ Compensation, and Administrative filings—covering every major filing type across the United States.
Built on ZestyAI’s Agentic AI platform, ZORRO Discover scales decision intelligence across the insurance industry, transforming over a decade of U.S. insurance filings into a single, transparent system of insight. Carriers can instantly benchmark competitors, analyze rating trends, and anticipate regulator feedback and objections in real time, turning regulatory filings from a compliance requirement into a strategic advantage.
Kumar Dhuvur, Chief Product Officer and Co-Founder at ZestyAI, said:
“Every corner of P&C faces the same challenge: too many filings and too little time. Now, whether it’s workers’ comp in Texas or commercial auto in California, teams can simply ask ZORRO and get instant, verified insights in real time.”
By analyzing past objections and outcomes, teams can anticipate regulators’ questions before they arise and move filings forward with precision. Live monitoring of new submissions keeps organizations current on competitor moves and market shifts, turning what was once a fragmented, manual workflow into a real-time decision system that helps teams act quickly and strategically.
With its conversational interface, users can simply ask ZORRO to surface insights that once took hours or days to uncover. Product, actuarial, and regulatory teams can now collaborate from a single, auditable source of truth, replacing manual searches and static spreadsheets with transparent, explainable intelligence that drives faster, smarter action.
ZORRO Discover is available now for all property and casualty insurance lines.
Start your trial.
Smarter Roof Age for Smarter Risk Decisions
The Next Generation of ZestyAI’s Roof Age Product
At ZestyAI, we know that better data leads to better decisions. That’s why we’ve invested in a major upgrade to our Roof Age product, trusted by leading carriers to improve risk selection, pricing, and operational efficiency in property insurance.
Today, we’re excited to share what’s new, what’s improved, and how these advancements are already helping carriers strengthen underwriting, rating, and inspection workflows.
What’s New in Roof Age
We’ve taken a holistic approach to improving performance, accuracy, and efficiency. Here’s what you’ll find in the latest release:
Refit model with double the training data
We’ve significantly enhanced the Roof Age model, doubling the size of our training dataset to improve performance across diverse housing stock, roof types, and geographies.
This expanded dataset incorporates more confirmed roof replacement events and broader regional variation, allowing the model to generalize more effectively to different parts of the country, including historically underrepresented regions.
The model is now better able to distinguish between full roof replacements and other types of roof-related activity, such as solar panel installation, patched sections, partial replacements, or home additions.
These events may alter the roof’s appearance or condition, but don’t represent a comprehensive replacement. By learning the subtle visual and contextual cues that separate these scenarios, the model delivers more accurate predictions and reduces the risk of misclassification.
Enhanced estimation for challenging cases
In cases where no building permit is available and roof replacement can’t be clearly confirmed via aerial imagery, our improved Roof Age Estimation Model takes over. This model, now trained on double the dataset, is purpose-built for ambiguity.
It leverages not only imagery and property-level features but also regional climatology, using knowledge of local weather patterns and environmental stressors to inform its estimate.
For example, a roof in the Southeast exposed to intense sun and humidity will age differently than one in the Pacific Northwest or Upper Midwest. Incorporating these regional factors helps improve estimation accuracy, even when direct replacement signals are unavailable.
ZestyAI also establishes a minimum roof age, providing additional clarity and confidence. Using our extensive, 20-year aerial imagery catalog, we can identify the earliest visual evidence of the current roof.
If no replacement activity is detected over a known span of time, we can confidently assert that the roof is at least that old.
This minimum age is then used not just as a floor, but as a valuable input to further refine the overall roof age estimate, narrowing the prediction with greater precision than models limited to single-source or snapshot data.
This capability provides underwriters and actuaries with a powerful, high-confidence signal, particularly valuable for pricing segmentation, inspection prioritization, and risk selection strategies.
Intelligent cross-validation logic
The model doesn’t rely on a single data source. Even when a strong signal like a building permit is available, it cross-validates with high-resolution aerial imagery to detect inconsistencies, like permits that were filed but not followed through, or replacements that occurred without permits.
This layered logic helps ensure predictions are grounded in current conditions, not just administrative records. It also improves detection of fraud, data entry errors, or outdated assumptions in property records.
This logic creates a "trust but verify" framework that boosts both precision and confidence in every prediction.
To illustrate, imagine a home built 12 years ago. The model begins by anchoring to the construction year, then scans forward through our aerial imagery catalog and permit records to assess whether a roof replacement has occurred.
By grounding the analysis in the property's timeline, the model avoids misinterpreting the original roof as a newer installation and increases confidence in identifying true replacement events.
Expanded imagery catalog
We’ve enriched our aerial imagery sources to improve roof verification across geographies. The result: more accurate verification of roof replacements and improved model performance in hard-to-cover geographies.
This helps carriers score more properties with higher confidence, especially in rural or previously under-covered regions.
Confidence scores for every prediction
Every Roof Age prediction now comes with a confidence score, helping carriers make more informed decisions. High-confidence predictions can be fast-tracked for automated processing, while lower-confidence scores can trigger secondary review or inspection.
This added transparency empowers carriers to make risk-based decisions not only on the prediction itself, but on how much to rely on it.
Improved Performance Behind the Scenes
We’ve also made significant infrastructure upgrades to enhance product speed and reliability.
- Reduced Latency: Infrastructure improvements have cut average response times to under 2.5 seconds per property, making Roof Age a real-time-ready solution for quoting and policy decisions.
- Stricter Quality Controls: We’ve added new safeguards to filter out imagery that’s blurry, outdated, or contains visual artifacts. Only high-resolution, high-confidence inputs are used to power predictions.
- Scalability: These backend improvements also allow us to handle larger portfolios with more concurrent requests. This is ideal for carriers integrating Roof Age into enterprise systems.
Easier Access for Every Workflow
Roof Age is available wherever you need it:
- In Z-VIEW: Easily visualize Roof Age predictions and supporting evidence with property-level insights directly in our web application.
- Via API: Seamlessly score entire portfolios and integrate directly into your quoting, pricing, or inspection strategies.
Ready to See the Results for Yourself?
The feedback from the market has been tremendous, and we’re just getting started. Want to see the results for yourself? We’re inviting carriers to pilot the new Roof Age model and evaluate its performance on their own book of business.
Get in touch to schedule your Roof Age pilot
Brava Roof Tile Selects ZestyAI’s Roof Age and Z-PROPERTY™ to Advance Data-Driven Roof Performance
AI-driven roof and parcel-level insights validate real-world performance of synthetic roofing solutions
ZestyAI announced that Brava Roof Tile, a leader in premium synthetic roofing solutions backed by Golden Gate Capital, has selected ZestyAI to validate the real-world performance of its roofing systems during past storms.
How Brava Roof Tile Uses ZestyAI’s Property and Roof Intelligence
Brava Roof Tile is leveraging three of ZestyAI’s proven solutions to bring greater clarity to roof performance and replacement opportunities. Roof Age synthesizes building permit data with 20+ years of high-resolution aerial imagery, applying advanced machine learning to deliver verified roof age estimates with 97% U.S. coverage.
Within Z-PROPERTY™, Digital Roof applies AI to assess roof complexity, materials, and condition, flagging vulnerabilities before they become costly failures, while Location Insights evaluates the broader parcel to surface risk factors such as vegetation overhang, yard debris, and secondary structure.
Together, these insights provide comprehensive coverage, unmatched accuracy, and fast deployment at scale, turning property-level data into actionable guidance on roof vulnerabilities and replacement opportunities.
Validating Real-World Resilience With Property-Level Data
“Brava is committed to helping homeowners protect their most valuable asset with roofs that combine durability, sustainability, and beauty,” said Matt Pronk, Chief Financial Officer of Brava Roof Tile.
“With ZestyAI, we gain a clear, data-driven view of how roofs perform in the real world and use those insights to guide families toward stronger, longer-lasting protection.”
“Brava Roof Tile is showing how ZestyAI's risk analytics can be applied to validate resilience in the real world,” said Attila Toth, Founder and CEO of ZestyAI.
“Our mission is to protect families, communities, and their financial wellbeing, and our unmatched coverage and accuracy make that possible at scale."
How ZestyAI Models Work: A Deep Dive into Property-Level Risk
At ZestyAI, we’re often asked:
What Does “Property-Level” Mean?
What Makes ZestyAI Different from Traditional Risk Models?
Are ZestyAI Models Approved for Use in Underwriting and Rating?
This post answers the most common questions we receive from underwriters, actuaries, regulators, and technology partners—using wildfire, hail, wind, water, and storm perils as examples of how we turn complex data into actionable insights.
What Does “Property-Level” Mean?
Traditional risk models often rely on ZIP codes, territories, or broad regional averages to assess hazard and vulnerability. Stochastic models may support property-specific analysis, but they typically require external data sources, which adds cost, complexity, and inconsistency.
At ZestyAI, we assess each structure based on its physical characteristics and how it interacts with the surrounding environment.
We assess:
- Parcel boundaries and building footprints
- High-resolution aerial and oblique imagery
- Topography, slope, and vegetation
- Structural details like roof shape, materials, and defensible space
By integrating climatology with the built environment, we generate contextual risk scores that capture how each property’s physical characteristics, regional climatology, and historical loss experience interact to shape real-world risk.
That drives smarter decisions in underwriting, pricing, and mitigation, without relying on assumptions or manually sourced data.
What Makes ZestyAI Different from Traditional Risk Models?
Traditional risk tools often rely on:
- Broad hazard zones that can’t distinguish risk within a ZIP code
- Infrequent model updates that fail to reflect current conditions
- Over-simplified proxies—often relying solely on factors like year built—without accounting for deeper structural nuance
- Manual inspections that are slow, inconsistent, and costly
ZestyAI takes a fundamentally different approach.
Our models:
- Use gradient boosted machines that capture complex interactions between property features and environmental conditions
- Are trained on millions of actual insurance claims, not simulations, ensuring outputs reflect real-world loss experience
- Leverage both imagery (e.g., high-resolution aerial and oblique photos) and non-imagery sources (e.g., permits, climatology, topography)
- Continuously incorporate new data to reflect changing exposures
- Provide parcel-level risk scores with full transparency and regulator-ready documentation
With 97%+ U.S. property coverage, ZestyAI delivers national models with localized precision, helping carriers segment risk, price accurately, and respond to today’s evolving climate risks.
Are ZestyAI Models Approved for Use in Underwriting and Rating?
Yes. ZestyAI’s models, including Z-FIRE™, Z-HAIL™, Z-WIND™, Z-WATER™, and Z-STORM™, have been approved for use in underwriting and rating across the U.S.
Our regulatory approach is grounded in a few key principles:
- Transparency: We provide clear, regulator-ready documentation, including model methodology, variable selection rationale, and statistical validation.
- Collaboration: We work directly with carriers and state regulators throughout the filing process, from pre-submission briefings to objections.
- Responsible Innovation: Our models are trained on real-world claims, regularly updated with new data, and built with fairness and explainability in mind.
We support filings with:
- Detailed methodology and input documentation
- Variable importance rankings and validation studies
- Pre-built regulatory summaries to streamline the review
- Ongoing support throughout the regulatory lifecycle
ZestyAI has a track record of success navigating regulatory review. We help carriers adopt cutting-edge risk models with confidence and compliance.
Roof Age vs. Roof Condition: What’s the Difference?
ZestyAI’s models distinguish between roof age and roof condition, treating them as complementary signals that together provide a more accurate picture of roof-related risk, especially for hail and wind.
Roof Age is validated using a combination of building permit data and aerial imagery, analyzed through multiple proprietary methods simultaneously. We assign confidence scores to each roof age and apply minimum roof age rules to avoid false positives, ensuring the data is robust, even in jurisdictions with limited permitting records.
Roof Condition is assessed through computer vision models applied to high-resolution aerial imagery. These models detect visual signs of degradation, such as discoloration, wear, patching, and debris, that may not correlate with official replacement dates.
Why does this matter?
Because many insurers rely solely on reported roof age, which is often missing, outdated, or self-reported.
Our approach captures:
- Properties with older roofs that are still in good shape (and may be lower risk)
- Properties with newer roofs already showing signs of wear (and may be higher risk)
- Up-to-date roof vulnerability that static datasets can’t match
Together, roof age and condition power smarter decisions in underwriting, pricing, and mitigation—grounded in observable reality, not assumptions.
Modeling Approach: Why Gradient-Boosted Machines (GBMs)?
ZestyAI's risk models use gradient boosted machines (GBMs), a machine learning technique that delivers powerful predictive performance while remaining transparent and regulator-ready.
We use GBMs because they:
- Achieve high predictive accuracy by combining many simple decision trees into an ensemble that learns from its own errors over time, ideal for capturing complex insurance risk signals.
- Model non-linear interactions between variables, such as how roof complexity, condition, and regional climatology jointly influence risk, something traditional models or GLMs often miss.
- Enable transparency and explainability, with tools like feature importance rankings, partial dependence plots, and SHAP values that help underwriters, actuaries, and regulators understand what’s driving risk scores.
- Support a wide range of input types, from imagery-derived features to structured data like permits, topography, and property characteristics, all in one unified framework.
The result: a modeling approach that delivers real-world impact, supporting smarter underwriting, better pricing, and confident regulatory adoption.
How Z-FIRE Evaluates Wildfire Risk
Z-FIRE is ZestyAI’s structure-level wildfire risk model, built to capture both traditional wildland fire exposure and the growing threat of urban conflagration. Unlike traditional hazard maps that apply uniform risk zones across ZIP codes or counties, Z-FIRE delivers granular, property-specific risk scores for every structure in the U.S.
The model includes two levels of scoring:
- Level One: Exposure Risk – Evaluates how likely a structure is to fall within a future wildfire perimeter, based on vegetation, slope, elevation, proximity to the wildland-urban interface (WUI), historical burn patterns, and regional climatology.
- Level Two: Structure Vulnerability – Assesses how likely that structure is to be damaged if a wildfire occurs nearby. This score factors in structural characteristics like building materials, defensible space, and surrounding fuels, extracted from aerial imagery using computer vision.
Together, these scores provide a more complete view of wildfire risk: not just where fires may happen, but how individual structures are likely to perform.
Z-FIRE also captures non-traditional wildfire scenarios, including embers and wind-driven fires that jump the WUI and ignite dense suburban and urban neighborhoods. This makes the model particularly valuable for identifying concentration risk, urban conflagration, and managing PML across books of business.
Z-FIRE is validated on millions of insurance claims and performs reliably across all geographies—from the forests of California and the grasslands of Texas to emerging risk zones in Colorado, Oregon, and the Eastern U.S.
How Z-HAIL Accounts for Roof Vulnerability
Z-HAIL is a property-specific hail risk model designed to assess not just the likelihood of hail, but how damaging it will be to a specific structure.
Unlike traditional models that rely on historical hail frequency alone, Z-HAIL captures the interaction between local climatology and structural resilience by analyzing:
- Hail climatology: storm frequency, hailstone size, and intensity at a hyperlocal level
- Roof geometry and materials: pitch, complexity, covering type, and other features that influence how hail impacts a roof
- Property-specific vulnerability factors: including building height, exposure, and roof condition (derived from imagery and computer vision)
By modeling how hail behaves in a given location and how a specific roof is likely to perform under those conditions, Z-HAIL delivers precise risk segmentation at the parcel level.
Carriers using Z-HAIL have seen significant improvements in underwriting performance. In an independent third-party review, Z-HAIL demonstrated a 20× lift in loss ratio segmentation between high- and low-risk properties—enabling more accurate pricing, better risk selection, and actionable mitigation strategies.
How Z-WIND Analyzes Wind-Driven Damage
Z-WIND is a property-specific model that evaluates vulnerability to both straight-line winds and tornadic activity by analyzing how wind climatology interacts with structure-level characteristics.
The model captures:
- Roof geometry: including shape, pitch, and surface area, which influence uplift forces
- Building elevation: to assess exposure to wind at various heights
- Local terrain and land cover: which impact wind speed, turbulence, and exposure to flying debris
- Historical wind climatology: including storm frequency and intensity
- Real-world claims data: to ensure outputs reflect actual loss performance
Z-WIND generates property-level frequency and severity scores, helping insurers move beyond broad wind zones to more precisely identify risk at the structure level. By understanding how specific buildings respond to local wind conditions, Z-WIND enables more accurate pricing, underwriting, and mitigation strategies across both inland and coastal regions.
How Z-WATER Tackles Non-Weather Water Losses
Z-WATER is an AI-powered model that predicts the frequency and severity of non-weather water and freeze claims at the property level, covering every structure in the contiguous U.S.
While many traditional models depend heavily on basic indicators such as “year built,” Z-WATER combines those inputs with a broader set of property, climate, and infrastructure features to capture the interaction between three core dimensions of risk:
- Construction & Architecture: Property-specific features that influence vulnerability and claim severity, such as number of bathrooms, number of stories, presence of a pool, and overhanging vegetation (a signal for potential tree root intrusion).
- Climatology: Environmental stressors like temperature swings and freeze/thaw cycles that contribute to pipe bursts and system strain.
- Local Infrastructure & Hydrology: How local plumbing systems and electrical grids perform when real-world cold snaps or heat waves exceed what regional codes anticipated, exposing systemic weak points that lead to burst pipes and interior water damage.
These variables are derived from aerial imagery, tax assessment data, and regional climate and infrastructure datasets, all processed through ZestyAI’s proprietary AI framework.
Z-WATER helps insurers:
- Set fair and adequate rates based on true exposure
- Target high-risk homes for mitigation (e.g., water sensors or shutoff valves)
- Streamline operations by automating low-risk decisions and focusing resources where they matter most
What Is Z-STORM?
Z-STORM is a predictive, property-specific model built for carriers that rate hail and wind as a combined peril. It provides structure-level risk scores across the contiguous U.S., enabling more accurate pricing, underwriting, and mitigation decisions.
Unlike traditional territory-based approaches, Z-STORM models how storm climatology interacts with the built environment—capturing the real-world conditions that drive loss at the individual property level.
The model incorporates:
- Storm climatology: frequency and severity of wind and hail events at a hyperlocal scale
- Structural features: roof shape, material, pitch, and condition—key factors in a structure’s vulnerability
- Environmental context: including open terrain and nearby vegetation, which can amplify damage
Z-STORM predicts both:
- Claim frequency: the likelihood a property will experience a storm-related claim
- Claim severity: the expected loss as a percentage of Coverage A, providing a more precise view of financial exposure
This dual prediction enables carriers to:
- Accurately rate combined wind and hail risk at the property level
- Target mitigation strategies (e.g., roof improvements that reduce exposure to both hazards)
- Improve risk segmentation and pricing
Z-STORM offers a single, AI-powered solution for capturing the true complexity of convective storm risk—from climate data to construction detail to expected loss outcome.
.webp)
California Casualty Selects Z-FIRE™ to Support California’s Sustainable Insurance Future
AI-driven wildfire analytics enhance underwriting precision and ensure mitigation efforts are reflected in coverage
ZestyAI announced today a new partnership with California Casualty, a trusted auto and home insurance provider serving educators, police officers, firefighters, and healthcare workers for over 110 years.
The collaboration will enhance California Casualty’s wildfire underwriting and pricing capabilities while reinforcing its long-term commitment to serving California’s community heroes and supporting the California Department of Insurance’s Sustainable Insurance Strategy (SIS).
Enhancing Accuracy, Supporting Affordability
California Casualty will deploy ZestyAI’s Z-FIRE™ model and Wildfire Mitigation Pre-Fill to better align premiums with property-specific wildfire risk and recognize homeowners’ efforts to mitigate that risk.
These advanced models analyze each property’s vulnerability based on factors such as topography, vegetation, building materials, defensible space, and the characteristics of the built environment.
Unlike traditional models that stop at the wildland-urban interface, Z-FIRE accounts for the dynamics of urban conflagration, where fire spreads rapidly from structure to structure in densely built neighborhoods. Wildfire Mitigation Pre-Fill complements this by automatically surfacing mitigation features at scale, bringing greater accuracy and transparency to underwriting.
Todd Brickel, Senior Vice President, Chief Risk & Product Officer at California Casualty, said:
“As wildfire threats intensify, our responsibility is to ensure that educators, peace officers, firefighters, and healthcare professionals continue to have access to reliable and affordable coverage."
"Partnering with ZestyAI equips us with data-driven insights needed to price risk accurately, reward mitigation, and sustain our role as a long-term solution in California’s insurance market.”
Commitment to California
California Casualty has long stood with California’s community heroes, protecting their homes in both city neighborhoods and wildfire-exposed areas. Even as other insurers have reduced their footprint, California Casualty continues to expand access to coverage in support of Commissioner Ricardo Lara’s Sustainable Insurance Strategy.
Through its investment in advanced wildfire analytics, the company is ensuring that affordability and availability can coexist in California’s evolving insurance landscape.
The strength of Z-FIRE’s analytics was reaffirmed during the 2025 Los Angeles wildfires, when the Palisades and Eaton fires escalated into fast-moving urban conflagrations.
The model’s performance reinforced how advanced analytics can anticipate where fire risk is greatest and help insurers strengthen preparedness and resilience well before events occur.
These insights enable California Casualty to maintain confidence in providing coverage for community heroes throughout California’s most challenging environments.
Attila Toth, CEO of ZestyAI, said:
“We are proud to partner with California Casualty, a company that has served community heroes for more than a century.”
“Our AI-driven models provide the transparency, accuracy, and property-level detail needed for insurers to remain confident in challenging markets, rewarding mitigation efforts and supporting regulatory goals for long-term stability.”
Built and validated on more than 2,000 historical wildfire events and two decades of claims data, Z-FIRE has been widely adopted by insurers across the West and recognized by regulators for use in both underwriting and rating.
See How Insights Turn Into Decisions
ZestyAI transforms data into action. Get a demo to see how the same AI powering our reports helps carriers make faster, smarter, regulator-ready decisions.