Reports & Research
Explore proprietary research packed with data, insights, and real-world findings to help carriers make smarter decisions.

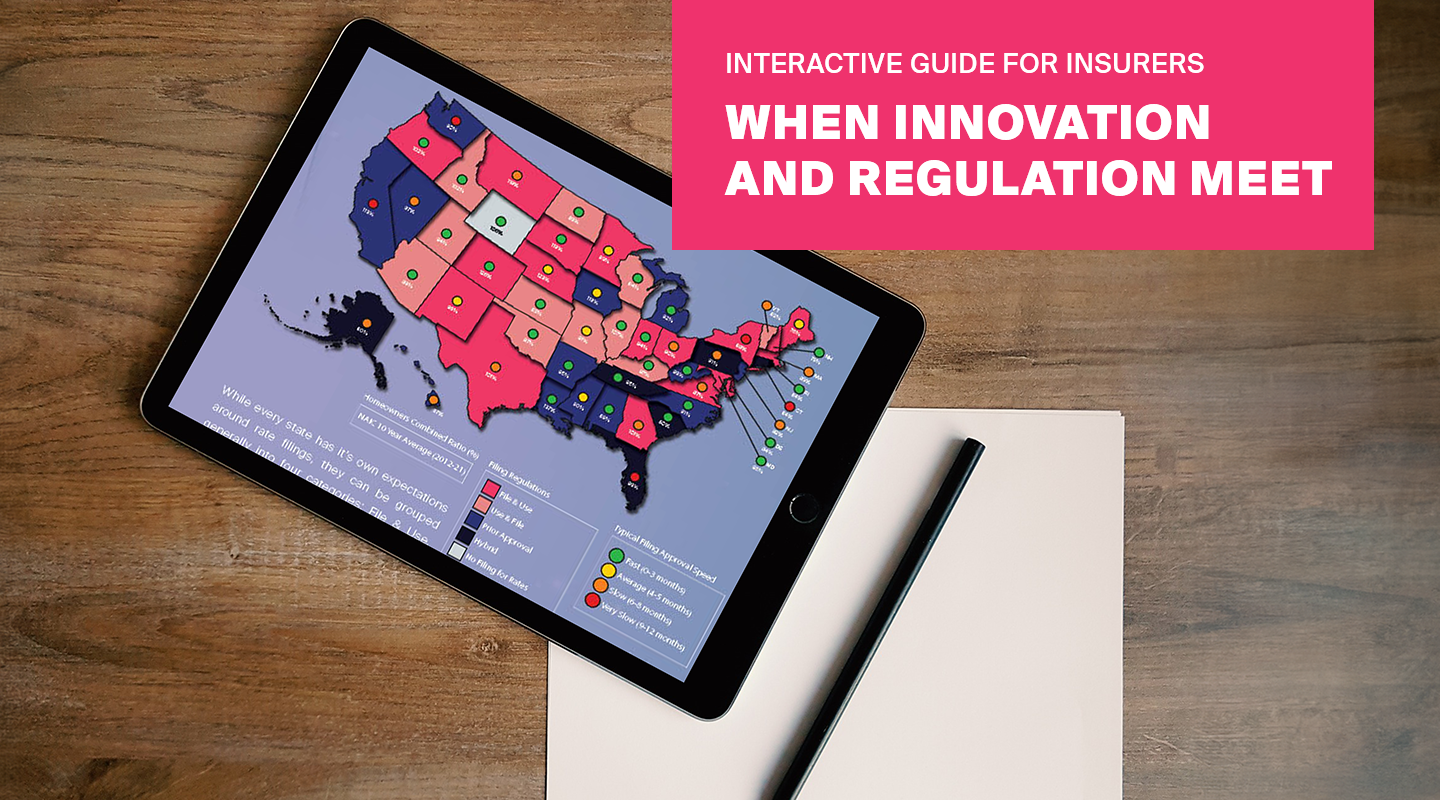
New Research: What Insurers Need to Know About AI and Regulatory Compliance
Master the future of insurance compliance with ZestyAI's interactive guide, featuring a state-by-state regulatory map, AI partnership checklist, and insights into emerging challenges.
In an ever-evolving regulatory environment, staying informed and adaptable is crucial. Our latest interactive guide, "When Innovation and Regulation Meet", offers a comprehensive toolkit for navigating the complexities of insurance compliance and the integration of AI technologies.
What's Inside?
- Regulatory Landscape Map: Delve into a detailed state-by-state analysis, uncovering the intricacies of filing laws and approval speeds.
- Staying Ahead of Regulation Changes: Learn how to stay prepared and ensure your compliance strategies are future-proof, aligning with the latest regulatory expectations.
- Essential AI Partner Checklist: Choosing the right AI partner is crucial for success. Our guide offers a meticulous checklist for selecting a partner that is not only compliant but also transparent and supportive, ensuring you make an informed decision.
- Emerging Regulatory Concerns: What do you need to know about privacy, bias, and AI oversight?
- Real-World Applications: Discover how ZestyAI's collaborative approach with regulatory entities has led to successful model approvals across the United States.
Why This Guide?
As the regulatory framework becomes increasingly complex, having a reliable and insightful resource is indispensable. Our guide is tailored for insurance professionals seeking to enhance their regulatory strategy, embrace AI innovation responsibly, and achieve a competitive edge in the market.
Ready to get up to speed on 2024's regulatory environment? Access the guide.
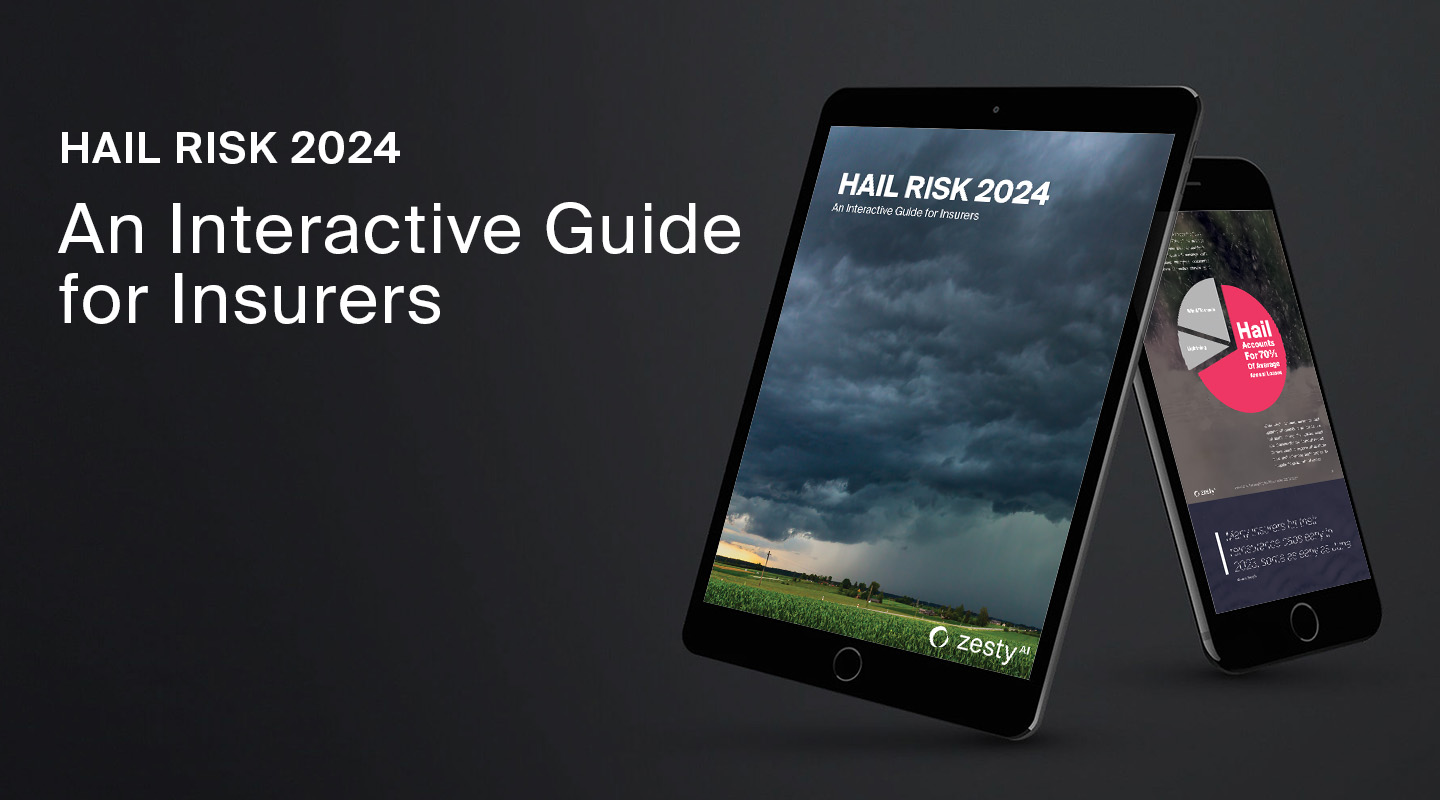
New Research: "Hail Risk 2024: An Interactive Guide for Insurers"
The landscape of hail risk management is undergoing a significant transformation. Our latest publication, "Hail Risk 2024: An Interactive Guide for Insurers," offers a critical examination, illustrated with compelling data, of the factors contributing to the alarming rise in hail-related losses over the last decade. Major changes to how hail is understood have changed how insurers should view the peril. This guide isn't just about understanding hail risk; it's about redefining how it is managed in the insurance industry.
Why This Guide is Indispensable:
- Losses Rising — Understand the key factors driving record-breaking hail losses, and why there's more to the story than just "climate change."
- Reinsurance — Learn why insurance carriers now shoulder more of the burden due to changing risk transfer relations.
- The Right Tools — Explore how AI-based climate risk models are supplementing stochastic and actuarial models for a full picture of climate risk.
- Actionable Steps — See how leading carriers are applying granular, property-level insights and learn the proactive steps they're taking to mitigate risks and losses.
Ready to get up to speed on hail risk in 2024? Access the guide.
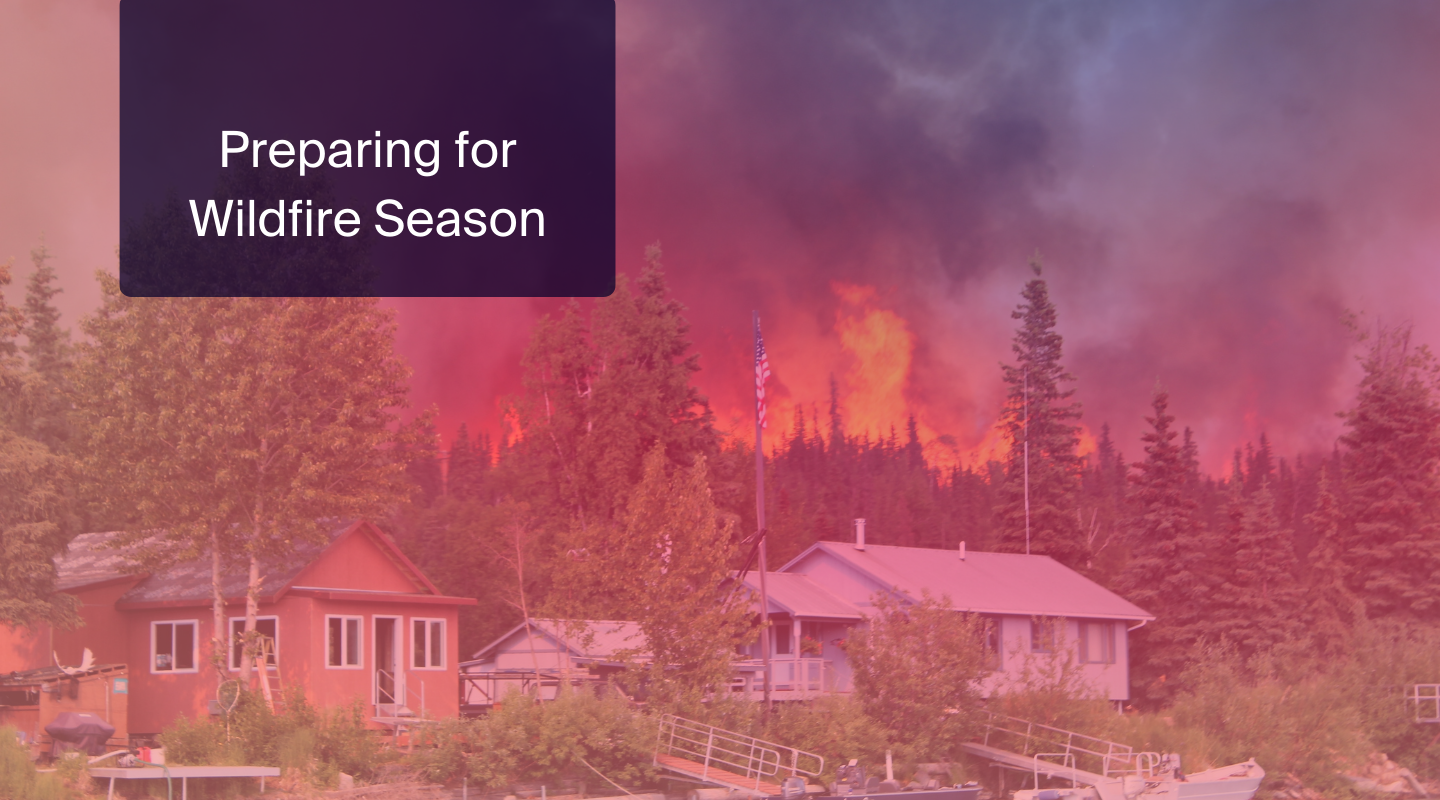
Future-Proofing Insurance: How to Prepare for Intensifying Wildfire Seasons
As ZestyAI unveils its annual Wildfire Season Overview, we can see that insurers are in a pivotal position to navigate the ongoing threat.
The insurance industry has been grappling for years with the skyrocketing losses caused by wildfires. As ZestyAI unveils its annual Wildfire Season Overview, we can see that insurers are in a pivotal position to navigate the ongoing threat.
Wildfire Risk Isn’t Going Anywhere
While we are currently experiencing a brief reprieve from the wildfire devastation of the last few years, the ongoing threat of wildfire remains at an all-time high.
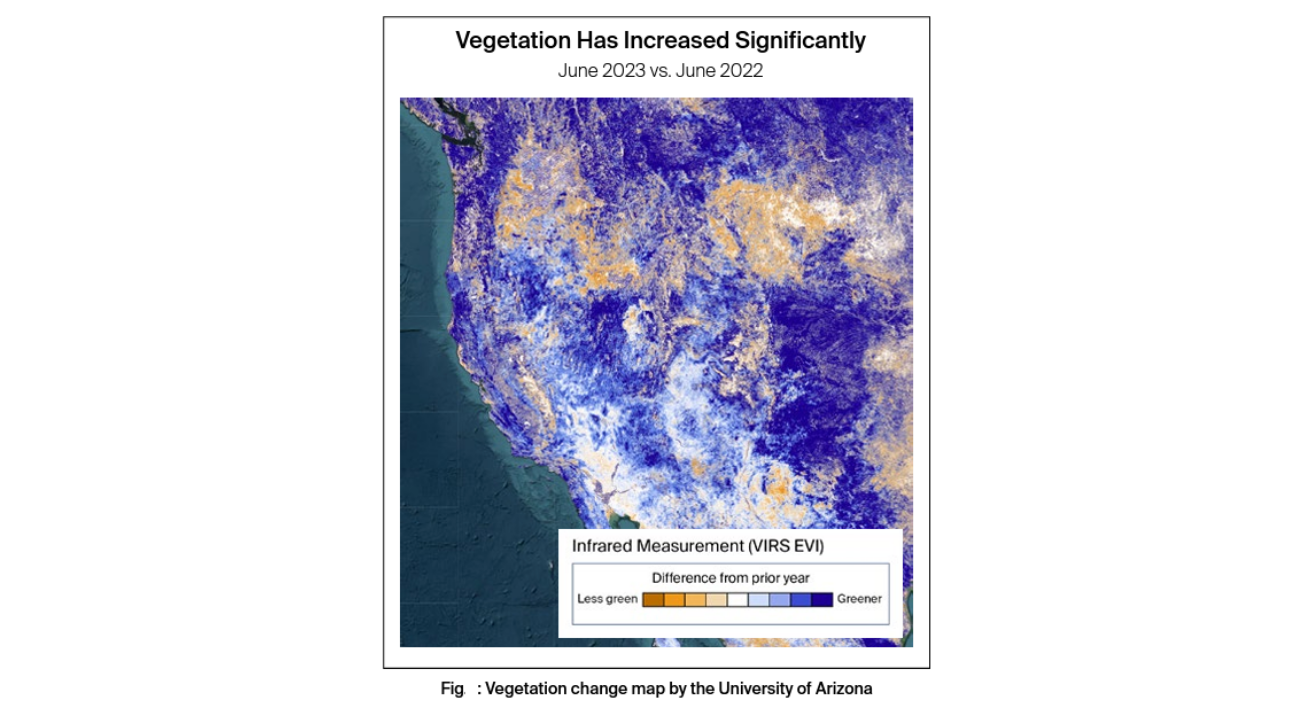
Extreme snow and rainfall across the West in 2023 have led to wetter-than-normal conditions that have acutely reduced the risk of wildfire. However, wetter conditions lead to vegetation growth, so despite 2023 presenting lower wildfire risk, the resulting vegetation accumulation, combined with persistent drought conditions in future years, will likely result in extremely high losses in the coming years. In fact, heavy rainfall has preceded many of the most severe wildfire years ever recorded in California.
Heavy rainfall has preceded many of the most severe wildfire years ever recorded in California.
Preparing for Future Wildfire Seasons
With high wildfire activity on the horizon, what steps can insurance companies take now to prepare for future wildfire seasons?
Here are three essential strategies:
1. Leverage Data for Better Understanding
Research by ZestyAI reveals that wildfires ravage 87% more land during drought years compared to non-drought years. With the western US still experiencing a megadrought that is the worst in over a millennium, it’s critical to understand the data and risks involved.
Not all homes face high risk. For the remainder, detailed property risk insights can highlight areas requiring risk mitigation. Integrate property-specific wildfire risk data into the underwriting and renewal process. This year is also an excellent opportunity to review a complete portfolio using an AI-powered wildfire risk assessment tool like Z-FIRE.
2. Educate and Empower Property Owners Through Transparency
Technology, particularly satellite/aerial imagery and artificial intelligence, can shed light on wildfire risks. Insurers can use this technology to assess the risk reduction measures that policyholders have implemented and understand how a property might withstand a wildfire.
This information is invaluable for educating homeowners and insurance agents. By knowing the specific actions that can be taken to reduce risk, such as clearing brush or using fire-resistant materials, both insurers and homeowners can be better prepared for wildfires.
3. Choose a Technology Partner Wisely
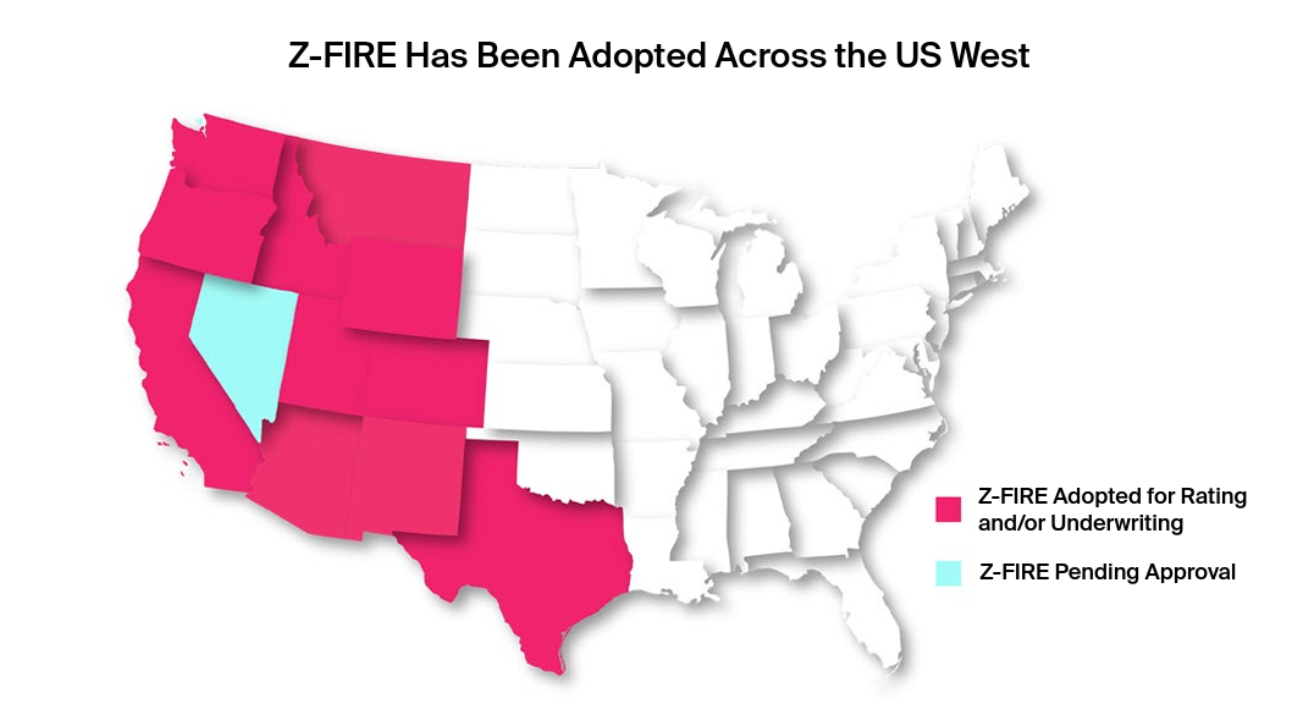
ZestyAI's Z-FIRE has set a benchmark by integrating loss data from over 1,500 wildfires and employing cutting-edge technology to derive insights on each property. By combining aerial and satellite imagery with machine learning and cloud computing, ZestyAI created Z-FIRE, a highly detailed wildfire risk assessment model.
Z-FIRE has been adopted by leading insurance carriers in every single western US state.
In 2022, Z-FIRE demonstrated remarkable performance. Its integration of data through machine learning and computer vision models has established Z-FIRE as a potent tool in wildfire risk assessment for both underwriting and rating.
Make Informed Decisions with Z-FIRE
Using Z-FIRE, insurance carriers, MGAs, and reinsurers can get access to actionable insights developed from detailed property-level risk factors. While wildfire losses may be inevitable, understanding in detail how individual properties contribute to average and tail risks is a large step forward.
The specific time and location of a wildfire is nearly impossible to predict. However, Z-FIRE can give carriers an assessment of the preconditions for that fire, and describe in detail the factors which contribute to it. Knowing, not guessing, which properties fall into a high-risk category is more important now than ever. We look forward to helping our customers through this fire season and many to come.
Z-FIRE Stands Alone in Compliance
Z-FIRE has been developed in partnership with top carriers and has been included in successful filings in California and many other western states. As regulators continue to push for additional transparency and accuracy in how insurers treat wildfire risk, AI-powered solutions provide a clear advantage because of their interpretability and sensitivity to changing conditions.
In 2023, California began requiring insurers to provide discounts based on mitigation measures, and in 2024 Oregon is poised to establish similar requirements on communications to homeowners. All of these changes create a burden on insurers, but those who can adapt to the new regulatory environment by leveraging knowledgeable partners like ZestyAI will have an advantage over competitors. AI is part of the solution, helping address climate risk and maintaining the insurability of properties across the US.
Download ZestyAI's 2023 Wildfire Season Overview
_(1440_%25C3%2597_800_px)_(2).png)
2023 Wildfire Season Overview: The Calm Before the Storm
ZestyAI has released its annual Wildfire Season Overview for 2023. This comprehensive report provides insights to assist insurers in effectively managing wildfire risk.
ZestyAI has released its annual Wildfire Season Overview for 2023. This comprehensive report combines insights from recent wildfire events, prevailing drought conditions, and cutting-edge advancements in artificial intelligence to assist insurers in effectively managing wildfire risk.
Download ZestyAI's 2023 Wildfire Season Overview
Here are some key findings from the report:
A Chance To Prepare While Wildfire Fuels Accumulate
Despite a brief respite from recent wildfire devastation, the current threat remains high. Over the past decade, wildfire risk has notably increased, particularly in California. However, the occurrence of extreme snow and rainfall in the West during 2023 has temporarily reduced the risk due to wetter conditions.
It's important to note that vegetation accumulation and ongoing droughts will likely lead to substantial losses in the coming years. California remains highly susceptible to losses and significant vegetation growth. This temporary relief in 2023 creates an ideal opportunity for insurers to review the risk technologies they have in place and embrace innovative solutions to prevent future losses.
No Role for Drought in Underwriting
Drought is indicative of fire intensity, but not losses. Although drought is an important factor in seasonal wildfire risk, the presence of drought shouldn't drive underwriting. Instead, insurers should look at property-specific solutions that consider wildfire risk over the lifetime of a policy.
Research has shown that this year's heavy rainfall may be a leading indicator for severe wildfire years to come. A comprehensive understanding of buildings, vegetation, and mitigation methods at the property level is necessary to effectively manage future wildfire risk.
A comprehensive understanding of buildings, vegetation, and mitigation methods at the property level is necessary to effectively manage future wildfire risk.
Using Advanced Models to Adapt to Changing Risks & Regulations
AI-powered risk models play a key role in mitigation. Insurers who write business in wildfire states have found increasing value in AI-powered wildfire risk models as they offer actionable risk insights, adapt quickly to changing climate risks, and comply with all regulations.
Over the last year, several western states have begun to implement new regulations for insurers in response to the changing risk environment. Discounts and transparency for mitigation efforts and property-specific decisions may become an industry standard as they have in California and Oregon.
What This Means for Insurers
In evaluating wildfire risk, many analyses tend to focus on the number of fires and the size of the area they burn. However, what really matters to insurance companies and property owners is the loss of structures and what can be done to mitigate those losses.
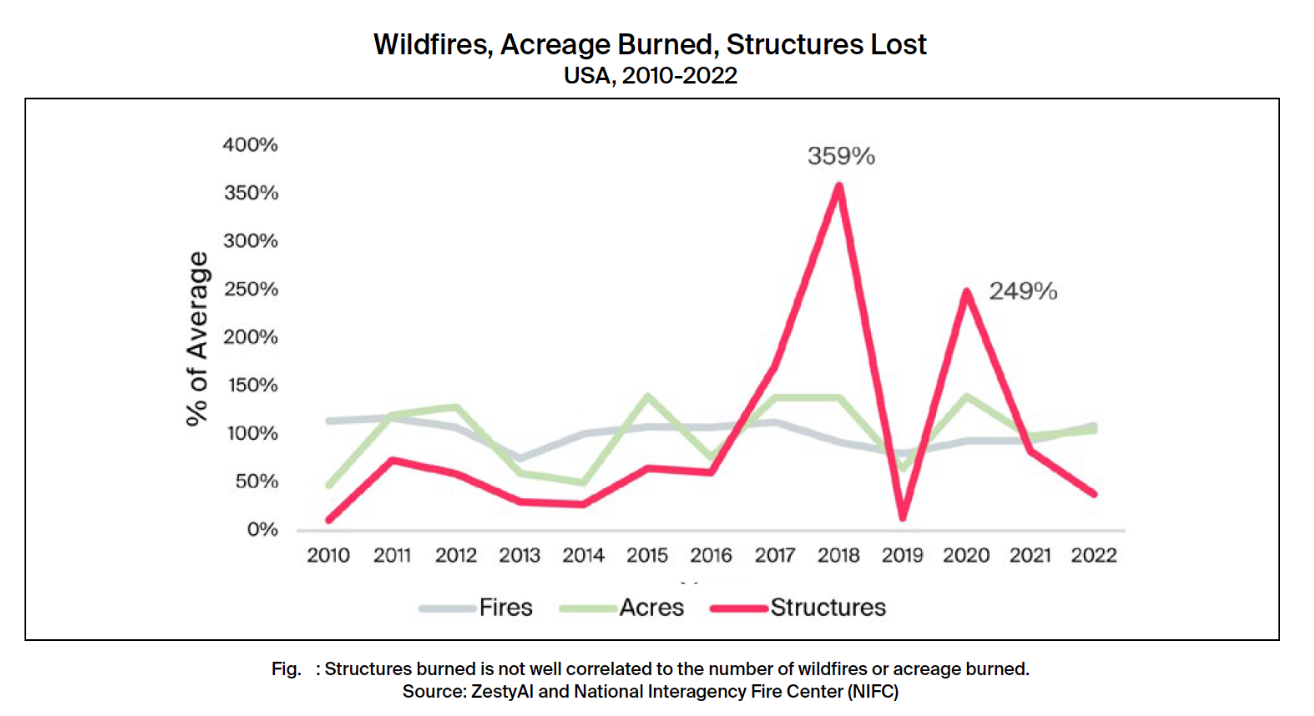
For example, those providing insurance in California might be surprised to learn that despite smaller losses in 2022 compared to 2021, the total national count of acres burned and fires ignited in 2022 actually exceeded that of 2021. This mismatch between yearly wildfire activity and the number of structures lost suggests that wildfire losses are not simply dictated by wildfire activity.
The most significant factor is not how many fires start, or how far they spread, but the potential resilience of every structure and what the communities and homeowners have done to prepare for wildfire exposure. Research from ZestyAI and IBHS shows that for a more precise understanding of potential losses, insurers need to zoom in on individual properties. They should consider a structure’s location, building materials, surrounding vegetation, and efforts taken by the surrounding community to prepare for wildfires.
Modern wildfire risk tools like ZestyAI's Z-FIRE do just that. They analyze individual property features and measure the impact of those features on the probability of loss. They also factor in nearby vegetation, community preparations, local infrastructure, and the lay of the land. This property-centric approach doesn’t try to predict exactly what a wildfire will do. Instead, it gives valuable information on how and why properties might be damaged by wildfires.
These models don't just offer a simple risk score, but also help explain what makes a particular property vulnerable and what steps can be taken to protect it.
Find out more, including how Z-FIRE performed in 2022, in this year’s Wildfire Season Overview.
Download ZestyAI's 2023 Wildfire Season Overview
.png)
As Hail Damage Continues Across the U.S., New Research From ZestyAI and IBHS Works to Make Hail Losses More Predictable
Research considers valuable data on smaller hailstone impacts, which are likely responsible for 99 percent of the impacts on a roof from a hailstorm.
San Francisco, CA, April 19, 2023 – Today ZestyAI, the leading provider of climate and property risk analytics solutions powered by artificial intelligence (AI), and the Insurance Institute for Business & Home Safety (IBHS) released new research examining catastrophic losses from severe convective storms, particularly hail. The study focuses on hail-driven losses in property and casualty insurance.
Hail losses are a persistent problem for property insurers’ risk management efforts. Historically, carriers have focused on intense events to predict hail risk, with supporting data confined to storms with hailstones larger than one or two inches. The study Small Hail, Big Problems, New Approach shows high concentrations of small hail are more important than previously thought, pointing to an opportunity to broaden data sets to account for the cumulative effect all hailstorms have on a roof’s susceptibility to damage over time, leading to a claim.
This new research shows all hail needs to be accounted for when modeling and ultimately understanding losses. Using data from all hail events, not just those with hail that meet the severe criteria of one inch or greater, allows carriers to consider valuable data on smaller hailstone impacts. Additionally, insurers can integrate climate and materials science to better understand hail frequency and severity. Research suggests using this new approach could perform as much as 58 times more accurately than looking at events with large and very large maximum hail sizes alone, allowing carriers to more effectively assess hail risk, achieve more profitable underwriting and open up ratings to previously avoided areas.
“As we’ve learned more about hailstorms, we've discovered storms that produce large concentrations of small hail are more common than we thought, and despite causing less individual damage than a single large hailstone, small hail, especially in high concentrations, is likely a meaningful contributor to the loss we see each year from hail,” said Dr. Ian Giammanco, managing director of standards and data analytics at IBHS. “Experiments also show large concentrations of smaller hailstones cause degradation to the asphalt shingles, specifically dislodging large amounts of granules. Once enough granules are lost, the underlying asphalt material can become more susceptible to aging and weathering. Repeated exposure to these types of hailstorms can shorten the life of an asphalt shingle roof and increase the damage caused by large hailstones in the next storm.”
“Hail losses are a persistent problem for property insurers’ risk management efforts,” said Attila Toth, founder and CEO of ZestyAI. “Three of the nation’s five largest publicly-traded P&C carriers mentioned hail as a key concern in 2022 financial reports. Greater losses have brought attention to hail risk, and the insurance industry needs better approaches to solve this problem.”
“Three of the nation’s five largest publicly-traded P&C carriers mentioned hail as a key concern in 2022 financial reports. Greater losses have brought attention to hail risk, and the insurance industry needs better approaches to solve this problem.”
Hail risk can be especially costly to insurers because, unlike other catastrophic perils like hurricanes and wildfires, it can be difficult to identify the storm that caused a hail claim. As a result, insurance carriers could be forced to raise overall premiums or introduce high deductibles to compensate for the added costs.
As climate and materials science have developed, more data has become available providing improved hail risk evaluation options that can lead to better decisions at earlier stages of the policy life cycle. Other benefits could include more profitable underwriting, a greater ability to rate previously-avoided areas and significantly reduced loss ratios.
For the complete ZestyAI and IBHS research paper visit this page.
About ZestyAI
ZestyAI offers insurers and real estate companies access to precise intelligence about every property in North America. The company uses AI, including computer vision, to build a digital twin for every building across the country, encompassing 200 billion property insights accounting for all details that could impact a property’s value and associated risks, including the potential impact of natural disasters. Visit zesty.ai for more information.
About the Insurance Institute for Business & Home Safety (IBHS)
The IBHS mission is to conduct objective, scientific research to identify and promote effective actions that strengthen homes, businesses and communities against natural disasters and other causes of loss. Learn more about IBHS at ibhs.org.
###
For more information, contact:
Linsey Flannery
Director of Communications, ZestyAI
416-939-9773
Mary Anne Byrd
Communications Director, IBHS
803-669-4216

90-Second Fact Sheet: The Reinsurance Market in 2023
Reinsurance rates are spiking to an all-time high. Fitch estimated a 20-60% rate increase for cedants in the overall property reinsurance market at the January 1st renewals.1 Terms and conditions are also tightening - many reinsurers are limiting their cedants to much higher attachment points2, or exiting CAT-exposed lines altogether
The main drivers for uptick in reinsurance rates
Our research has found three drivers underpinning the trend:
1. Devastating CAT losses, particularly from secondary perils
59% of all CAT losses come from secondary perils3, and those losses have caused major shifts in the reinsurance landscape. Howden estimates that global property CAT reinsurance rates were up 37% at the January renewals4.
2. A new urgency to improve return on capital
“When the cost of capital is equal to the rate of return, something has to change.” - Aditya Dutt, CEO of Aeolus Capital Management5. The reinsurance industry has underperformed since 2017, with an average return on equity of just under 5%6. Poor underwriting performance was a key driver, with an industry average 101% combined ratio over the same period7. Reinsurers are poised to use the tightening market as a chance to improve performance, with Fitch forecasting a 4pp underwriting margin expansion for reinsurers in 20238. Unfortunately for primary insurers, Goldman Sachs predicts that the same tightening market will create significant volatility for cedants9.
3. Value erosion in reinsurer investment portfolios
Macroeconomic factors are driving significant unrealized investment losses for reinsurers, particularly on fixed income portfolios due to rising interest rates. Aon estimates that these investment portfolio losses drove a 17% decline in global reinsurance capital across the first 9 months of 2022, with some players reporting equity value losses as high as 40-50% over that period10. Reinsurers will look to shore up these losses with better underwriting performance, which likely means tougher rates for primary carriers.
How property insurers can improve their odds with AI-powered predictive climate and property risk platforms
These factors mean that primary insurers can expect challenging reinsurance negotiations at the June 1st renewal deadline, particularly on property lines. However, new AI-powered predictive climate and property risk platforms can improve the odds for property insurers in three areas:
1. Rapid improvements in risk mitigation
Implementation-free portfolio reviews can quickly drive major loss ratio improvements.
2. Turn the tables of CAT risk screening in your favor
Improving data quality can lead to more favorable stochastic model portfolio screens, particularly with insight about the roof.
3. Enter the room as a leader in cutting-edge risk practices
Showing the same commitment to new technologies as industry leaders can help cedants build a better case.
Conclusion
With the right mitigation action and a cutting edge view of portfolio risk, cedants can navigate the upcoming 6/1 renewal successfully.
Learn more about how an AI-powered predictive climate and property risk platform can help you.
------------------------------------------------------------------------
Sources
1 & 8 - Fitch, Reinsurers’ Underwriting Margins to Expand by 4pp in 2023
2 & 3 - Gallagher Re, Gallagher Re Natural Catastrophe Report 2022
4 - Howden, Howden’s renewal report at 1.1.2023: The Great Realignment
5 - AM Best, Reinsurance: Roundtable Discussion on Renewals and What 2023 May Hold
6, 7 & 10 - AON, Reinsurance Market Dynamics
9 - Reinsurance News, Hard market to increase volatility for primary insurers: Goldman Sachs
See How Insights Turn Into Decisions
ZestyAI transforms data into action. Get a demo to see how the same AI powering our reports helps carriers make faster, smarter, regulator-ready decisions.