Reports & Research
Explore proprietary research packed with data, insights, and real-world findings to help carriers make smarter decisions.

Why Coverage Architecture — Not Pricing — Is the New P&C Competitive Battleground
For years, competitive analysis in P&C has centered on pricing. But a ZestyAI analysis of 2M+ carrier filings shows the real battleground has moved underneath the price tag: carriers are quietly redesigning the mechanics of coverage itself — deductibles, settlement triggers, exclusions, and conditional language — in ways that materially change loss outcomes long after the policy is bound. These changes accumulate across filings, are easy to miss until a loss occurs, and are reshaping competition more durably than rate moves ever did.
About this analysis. Findings are drawn from Zorro Discover, ZestyAI's AI agent purpose-built for insurance-specific research. Zorro ingests every public P&C filing submitted over the past decade (2M+ filings, 200M+ pages), preserves table structure during processing, and grounds every response in source filings. The report focuses on homeowners insurance across high-pressure states, where coverage redesign is most advanced and most measurable.
Want the data? Download the full report → — with tier-by-tier and state-by-state breakdowns.
Why doesn't price competition tell the whole story anymore?
Pricing is still the most visible competitive lever, but it's also the easiest to benchmark and the fastest to neutralize. Coverage controls behave differently. A percentage-based wind/hail deductible, an actual cash value roof endorsement, or a cosmetic damage exclusion all change a carrier's loss exposure in ways that won't show up in a rate comparison and won't surface until a claim is filed. Two carriers can quote nearly identical premiums on the same property and end up with materially different exposure to a single hailstorm.
That's the shift. Coverage architecture is now where carriers are actually deciding how much risk they keep.
What are carriers actually redesigning?
Four levers do most of the work:
- Deductibles. Percentage-based wind/hail deductibles, often tiered by territory or roof material, that materially change the carrier’s loss participation before settlement even begins.
- Settlement triggers. Age- and material-based rules that move roof claims onto actual cash value (depreciated) settlement rather than full replacement cost.
- Exclusions. Cosmetic damage exclusions, anti-matching language, and growing carve-outs for soft metals (gutters, vents, frames) and solar panels.
- Conditional language. Mandatory inspections, geographic restrictions, and credits or surcharges that toggle coverage based on property characteristics.
Individually, each of these is a small mechanical change. Collectively, they redefine the product. Coverage controls aren't temporary responses to volatility anymore — they've become the baseline.
How are tier and state responses diverging under the same catastrophe conditions?
Carriers are adopting similar mechanisms — but assembling them very differently. Different tiers — nationals, large multi-line carriers, regional mutuals, and specialty writers — combine deductibles, settlement triggers, and exclusions in distinct configurations even when facing the same severe convective storm or wildfire exposure. State-level patterns diverge just as sharply: a market like Texas has converged on percentage deductibles and ACV settlement across nearly every filing, while a market like North Carolina is still standardizing the language for some endorsements at the rating bureau level.
This is what makes coverage architecture so durable as a competitive moat. Pricing differences can be matched in a single filing cycle. Coverage architecture takes years to assemble, defend at the regulator, and operationalize through underwriting and claims — and once it's in place, it's hard to undo.
What does this mean for 2026 competitive strategy?
The implication for product, underwriting, and competitive intelligence teams is straightforward: tracking competitor rate changes alone now produces an incomplete picture of the market. The carriers that win 2026 will be the ones watching the full coverage architecture — deductibles, settlement triggers, exclusions, conditional language, and how they're combined — and translating those patterns into their own product roadmaps. Filings have become both the strategy document and the audit trail. Pricing is increasingly just the cover sheet.
Get the full report
The New Competitive Battleground in P&C Insurance →
The full report walks through tier-by-tier and state-by-state adoption patterns, names the specific endorsements and conditional language reshaping homeowners coverage, and shows how loss outcomes diverge under the same catastrophe conditions when carriers assemble these levers differently.
The Hidden Redesign of P&C Insurance: What 2 Million Filings Reveal About 2026
Across personal auto, workers' compensation, commercial auto, and homeowners, P&C carriers are rewriting their products faster than at any point in the past decade — and the clearest signal isn't market commentary, it's the filings themselves. ZestyAI used ZORRO Discover™ to review more than 2 million SERFF filings, with a deep dive into 1,700+ homeowners filings across 58 carriers and $51B in premium in five severe convective storm states. The findings show carriers redesigning coverage faster than most teams can track, regulators tightening expectations alongside, and — counterintuitively — smaller carriers leading adoption of the most material changes.
About this analysis. Insights are drawn from Zorro Discover, an AI agent purpose-built for insurance-specific research. Zorro ingests every public P&C filing submitted over the past decade (2M+ filings, 200M+ pages), preserves table structure during processing, and grounds every response in source filings. The homeowners deep dive covered Texas, Oklahoma, Colorado, Ohio, and North Carolina from 2023 to 2025. Presented by Stephanie Kuczynski, Director of Risk Analytics at ZestyAI (formerly Progressive, American Integrity, and The Hartford).
Prefer to watch instead? Access the full on-demand session → — full state-by-state data, tier-by-tier breakdowns, and live Q&A.
What's changing in personal auto filings?
2025 personal auto filings show a clear divergence. Most filings remain mechanical, but a meaningful subset is layering telematics signals, vehicle feature factors, and combined rating structures into a single filing rather than tweaking one variable at a time. COVID is still in the data — many carriers continue to exclude 2020 entirely or reset older years to a post-pandemic baseline before trending forward. Meanwhile, regulators are raising the proof bar: model factors increasingly need direct statistical support to be approved.
The 2026 advantage will go to carriers that can move fast and defend each change clearly.
How is the loss cost multiplier reshaping workers' comp?
In workers' compensation, the loss cost multiplier (LCM) is no longer a tuning knob — it's become the primary economic and structural control surface, subject to continuous regulatory oversight. Carriers are building risk segmentation directly into LCM structure rather than layering it on through schedule credits, and competitive pressure now shows up as surgical, state-level LCM moves rather than broad national adjustments.
What does the rideshare picture look like in commercial auto?
The market is splitting. Some commercial auto programs decline rideshare exposure outright; others continue to write it but rate it through negotiated, individually set prices that diverge sharply between states. A handful of filings have also begun referencing autonomous and driver-assist use at the rule level — early intent signals, even where pricing isn't yet defined.
What did 1,700+ homeowners filings reveal about severe convective storm?
This is where the redesign is most visible. The most striking finding: smaller Tier 4 carriers — regional mutuals, farm bureaus, and specialty writers — are leading adoption of percentage deductibles, ACV roof endorsements, and cosmetic damage exclusions, while Tier 1 nationals tend to wait and follow. Tier 4 carriers can't spread severe convective storm exposure across geographies or perils, so they have to manage it surgically.
The financial stakes are real. A single cosmetic damage exclusion can remove 15–25% of hail claim dollars from a carrier's books, and ACV settlement can shift 30–60% of roof replacement cost back to the insured. State-level patterns diverge as much as the carrier strategies do — Texas is the most restrictive market across nearly every endorsement, while North Carolina has barely adopted cosmetic damage exclusions at all because its rating bureau is still standardizing the language.
Regulators in states like Colorado and Texas now require actuarial parity: proof that premium credits given for these endorsements match the loss reductions they're claimed to produce.
What it means for 2026 product strategy
Across every line, the same pattern emerges: better data is producing faster product moves, and regulators are responding with tighter expectations for how that complexity is supported and explained. The carriers that win 2026 will be the ones that can see competitor filing moves in days rather than weeks, defend each change with traceable evidence, and translate state-specific patterns into targeted product decisions. Filings have become both the strategy document and the audit trail.
Watch the full session on demand
The Hidden Redesign of P&C Insurance: What 2 Million Filings Reveal About 2026 Product Strategy →
The on-demand session goes deeper on the homeowners study with full tier and state breakdowns, plus live Q&A on anti-matching, solar panel exposure, ACV labor depreciation, lendability under Fannie/Freddie guidelines, and more.
Access the on-demand recording — or request a trial of Zorro Discover to run your own filings analysis on any line, state, or carrier set.
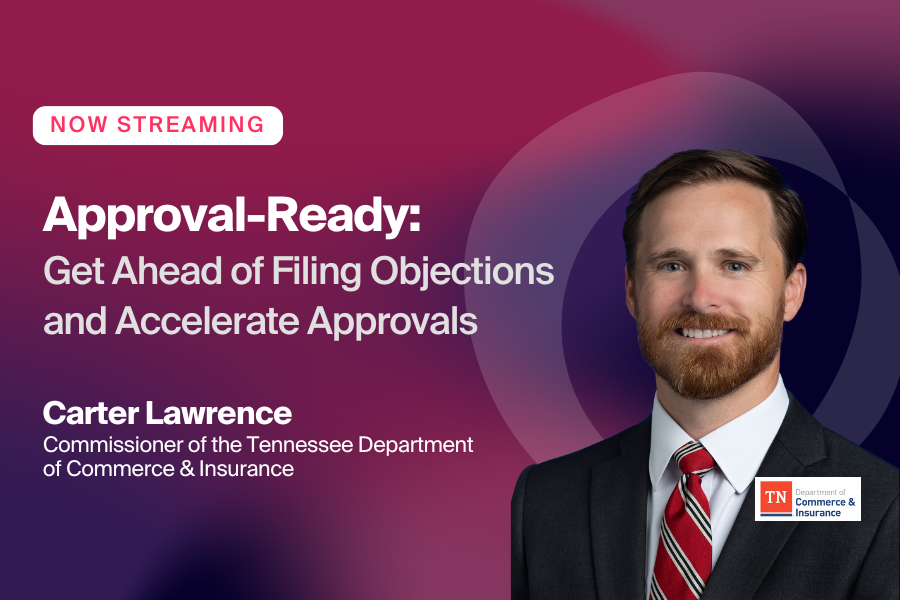
Becoming “Approval‑Ready”
Most filing delays are self-inflicted; not by regulators, but by carriers submitting filings with missing pieces, unclear narratives, or outdated requirements. In prior-approval states, those slips don’t just slow things down; they can freeze millions in premium for months. That was the core message of ZestyAI’s recent webinar, Approval‑Ready: How Carriers and Regulators Can Accelerate Filings, featuring Carter Lawrence, Commissioner of the Tennessee Department of Commerce and Insurance, and Bryan Rehor, Director of Regulatory Strategy at ZestyAI.
Watch the full session on demand here: Approval‑Ready: How Carriers and Regulators Can Accelerate Filings.
What regulators want from rate filings
Commissioner Lawrence opened with a simple reminder: regulators are people first, operating under clear statutory mandates but deeply focused on maintaining a healthy, competitive insurance market for the consumers they serve.
For carriers, that means relationships and preparation matter. He urged companies to proactively meet with departments, especially before submitting novel products or complex filings that benefit from early discussion.
Why filing delays cost insurers millions
From the carrier perspective, Bryan Rehor shared data from ZORRO Discover, ZestyAI’s agentic AI platform for competitive intelligence trained on hundreds of millions of pages of P&C filings, objection letters, and regulations. In prior‑approval states, ZORRO’s analysis shows that after the first objection, each additional objection typically adds about two months to the approval timeline, and incomplete responses can add another two to four months.
Those delays are often driven by preventable operational misses rather than disagreements over rate indications: missing actuarial exhibits, incomplete predictive model documentation, outdated checklists, procedural gaps, and under‑explained catastrophe assumptions. When ZestyAI’s team quantified the impact across lines, we estimated that delayed approvals translate into tens of millions of dollars per day in unrealized premium changes for the industry.
How ZestyAI’s ZORRO Discover helps carriers become approval‑ready
The panel converged on a key idea: the industry needs to move from reactive, objection‑driven workflows to proactive, intelligence‑driven ones. For regulators, that means using technology to reduce low‑value manual review so teams can focus on complex judgment calls; for carriers, it means embedding regulatory awareness and quality checks directly into rate filing workflows.
ZORRO Discover continuously ingests regulatory filings and related materials, so it flags gaps against current checklists, common objection themes, and emerging expectations in each state before a filing is submitted. Combined with ZestyAI’s regulator‑approved peril models and rate service organization capabilities, carriers can submit more transparent, thoroughly supported filings that earn trust and move faster through regulatory review.
FAQs: approval‑ready insurance filings and ZORRO Discover
What is ZORRO Discover from ZestyAI?
ZORRO Discover is ZestyAI’s agentic AI platform for competitive and regulatory intelligence in P&C. It analyzes 2M+ SERFF filings and related materials across all 50 states, turning millions of pages into real-time, citation-backed insights. For regulatory teams, it surfaces objection patterns and regulator expectations upfront, improving research efficiency by 20X. This helps teams run faster and more accurate pre-submission QA, draft cleaner filings, accelerate approvals, and reduce adverse selection.
How can insurance-specific AI reduce filing objections?
Agentic AI platforms for competitive intelligence, such as ZORRO Discover, scan millions of filings and related materials, including checklists, statutes, and historic objection letters. They help teams flag missing actuarial support, outdated checklists, weak justifications, and documentation gaps before submission. This “pre‑flight” QA reduces procedural errors that trigger avoidable objections and multi‑month delays.
How does ZestyAI help carriers be "approval-ready”?
ZestyAI helps carriers be approval-ready by strengthening both the models they file and the way those filings are prepared. Our peril models are filed through a Rate Service Organization (RSO) with standardized, regulator-tested documentation and a growing track record of approvals that carriers can reference as precedent. On the process side, ZORRO Discover provides pre-submission QA using regulatory objections and competitive insights. Together, this gives carriers more complete, regulator-aligned filings, fewer avoidable objections, and faster, more predictable approval timelines.
Why do prior‑approval states create unique challenges?
In prior‑approval states, rate and product changes cannot take effect until they are signed off by the Department of Insurance (DOI), so each objection round adds real financial cost as actuarially indicated changes sit idle. ZORRO Discover’s analysis shows that every additional objection can add months to the timeline, making operational quality and proactive compliance crucial levers for profitability.
How does ZestyAI support regulators and carriers at the same time?
ZestyAI reduces friction on both sides of the filing process by providing regulators with better documentation and helping carriers.
For regulators:
- Standardized, RSO-filed model documentation that’s easy to review.
- Regulatory precedent from prior approvals, reducing model-review burden.
- Clear, transparent methodology aligned with statutory expectations.
For carriers:
- Faster approvals by referencing ZestyAI’s existing model approvals.
- Fewer avoidable objections through ZORRO Discover’s QA and objection-pattern insights.
- More complete, regulator-aligned filings with clearer documentation and rationale.
Outcome:
Regulators receive fully documented, RSO-filed models that are easier to review and validate. Carriers benefit from two advantages:
- Clear insight into regulatory expectations to help them avoid common filing errors.
- The ability to reference ZestyAI’s existing model approvals, which provides regulatory precedent and helps their own filings move through review more quickly.
Together, this reduces avoidable objections and creates a more efficient, predictable approval process for both sides.
To hear directly from Commissioner Carter Lawrence and ZestyAI’s regulatory experts, watch the full webinar on demand: Approval‑Ready: How Carriers and Regulators Can Accelerate Filings

How P&C Carriers Are Using Agentic AI for Competitive Intelligence
Competitive intelligence in P&C insurance is still slow, manual, and scattered across PDFs — and the gap between when a competitor files a rate change and when most carriers learn about it is measured in weeks rather than days. Agentic AI is collapsing that gap. A ZestyAI on-demand session shows how analysts, actuaries, product managers, and compliance leads are using Zorro Discover™, ZestyAI's purpose-built agentic AI for insurance, to surface competitor rate changes, coverage shifts, regulatory objections, and trend data in seconds rather than hours.
About this session. Real-Time Market Intelligence for P&C Carriers is a live walkthrough of how agentic AI is being applied to filing research and competitive analysis in P&C insurance. Hosted by Somayaji Ayalasomayajula, Product Manager at ZestyAI, and Sam Fetchero, Head of Marketing.
Prefer to watch instead? Access the full on-demand session → — includes a live Zorro Discover walkthrough and early-customer reactions.
Why is traditional P&C competitive intelligence so slow?
Because the source material is unstructured. Filing data lives across SERFF, state DOI portals, and individual carrier submissions — in PDFs, rate manuals, rule pages, exhibits, and objection responses. Each filing is a multi-document package that has to be retrieved, opened, read, and synthesized to answer even simple questions: What did Carrier X change in their roof endorsement? How did the regulator respond to the wildfire surcharge? Which carriers added telematics factors in the last cycle? Multiply that across every competitor, every state, and every filing cycle, and the workflow becomes the bottleneck. Most teams cope by sampling — tracking a few competitors closely and missing everything else.
The result is a structural latency problem. By the time the relevant insight reaches the product or pricing team, the market has often already moved.
What is agentic AI for insurance competitive intelligence?
Agentic AI for insurance competitive intelligence is AI built to autonomously search, interpret, and synthesize regulatory filings — including rate manuals, rule pages, forms, exhibits, and objection cycles — and return specific answers about competitor behavior, regulatory trends, or filing strategy without requiring an analyst to manually retrieve and parse the underlying documents.
What separates it from general-purpose AI is grounding. Agentic AI for insurance is constrained to insurance-specific source material (every public P&C filing, in Zorro Discover's case), optimized for insurance language and structure (rate manuals, rule pages, statutes, actuarial guidance), and built to preserve filing structure during retrieval so tables, exhibits, and multi-document packages can be reconstructed during analysis.
The practical effect: research that used to take a competitive intelligence analyst hours or days returns in seconds, with citations back into the source filings.
What questions can carriers actually answer in seconds?
The patterns that show up most often in real use:
- Competitor rate change tracking. Surface the substance of a competitor's filing the moment it's published, not weeks later.
- Coverage and endorsement shifts. Identify changes to deductibles, exclusions, settlement triggers, and conditional language across carriers in a state or peril.
- Objection and approval patterns. Pull the full objection history on a topic — wildfire surcharges, AI-based factors, telematics — and craft regulator responses against what's already been approved or contested.
- Cross-state and cross-carrier comparison. Compare how carriers are filing the same concept across multiple states, or how a single carrier is positioning differently across regions.
- Trend analysis. Aggregate filing patterns to surface the slower-moving shifts — segmentation moving upstream into LCMs, accumulating coverage controls, regulator focus areas — that don't show up in any single filing.
Where does this fit in the carrier workflow?
The session is designed for analysts, actuaries, product managers, compliance leads, and underwriting strategy teams — the people whose decisions depend on knowing what competitors and regulators are actually doing right now. The bigger shift it points to: competitive intelligence is becoming less about who has the most analysts manually reading filings, and more about which carriers can route filing intelligence directly into the hands of the people making product and pricing decisions. Speed-to-insight is increasingly the moat.
Watch the full session on demand
Real-Time Market Intelligence for P&C Carriers →
See how analysts, actuaries, and product strategy teams are using Zorro Discover™ to track competitor filings, coverage shifts, and regulatory objections in real time — and what early users are saying about the workflow change.
Watch the on-demand session — or request a trial of Zorro Discover to run the same analysis against your own competitive set.

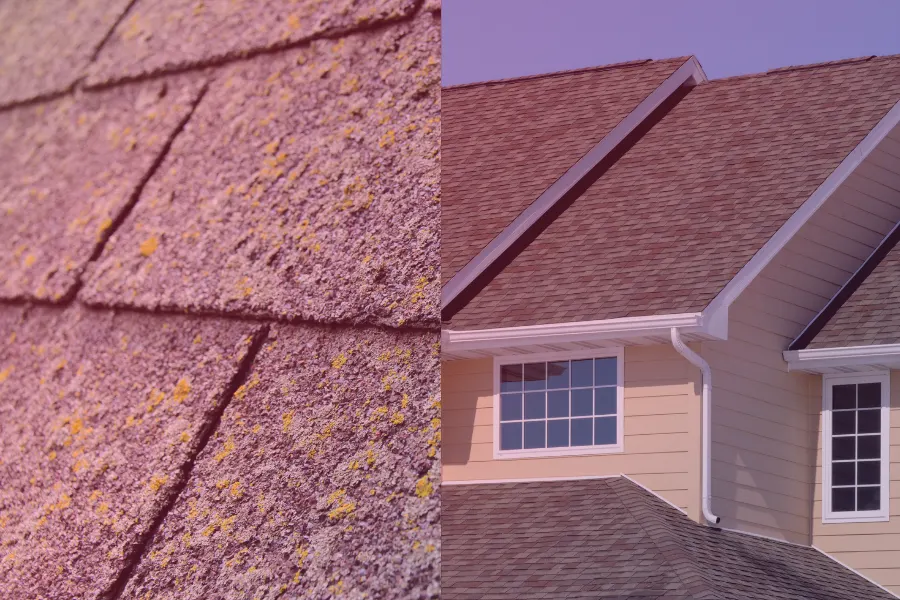
The Roof Age Blind Spot in P&C Insurance
Roof age is a powerful predictors of property risk, yet insurers continue to rely on self-reported data that is often wrong. Our analysis uncovers just how costly that blind spot can be.
In property insurance, roof age is one of the most critical factors in assessing risk. Yet too often, carriers rely on self-reported or agent-supplied data that is incomplete or inaccurate.
ZestyAI’s recent analysis of 500,000+ properties revealed widespread discrepancies in reported roof age. The result? Mispriced policies, unexpected losses, and operational inefficiencies that impact the bottom line.
As climate volatility grows and reinsurance pressure intensifies, overlooking the true condition and age of a home’s largest, most exposed surface is a risk no carrier can afford.
What’s Inside
- Uncover the biggest myths and blind spots in roof age records.
- Understand why traditional data sources, like claims systems and permits, fall short in providing accurate roof age.
- Learn how a multi-source verification strategy, combining aerial imagery, permits, tax records, and AI, offers a blueprint for improvement and 97% national coverage.
- Explore why roof age is a predictor of losses across multiple perils, not just wind and hail.
- Discover the one-two punch of verified roof age and real-time condition insights, delivering a complete view of risk, even for young roofs with hidden problems.
- Align your roof age data with growing regulatory expectations, particularly in states like Florida.
Deferred Maintenance Adds $317B in Exposure for Insurers
New research from ZestyAI reveals that 62% of U.S. homeowners are deferring critical home maintenance, adding up to $317 billion in potential claims exposure for insurers.
These findings come as Severe Convective Storms (SCS) caused an estimated $58 billion in insured losses in 2024, surpassing hurricane-related losses and marking the second-costliest SCS year on record.
Tornadoes, hail, and wind events now account for over 60% of all U.S. catastrophe claims, and research from the Insurance Institute for Business & Home Safety (IBHS) shows that roof damage accounts for up to 90% of residential catastrophe losses.
Key Findings from ZestyAI’s Homeowner Survey
According to ZestyAI’s nationally representative survey, 62% of homeowners have delayed essential repairs due to budget constraints, representing nearly 59 million U.S. homes with unaddressed vulnerabilities. Forty percent said they would rely on an insurance claim to cover major repairs like roof replacement, adding up to an estimated $317 billion in potential exposure for carriers.
Alarmingly, 63% of homeowners who weren’t living in their home at the time of the last roof replacement don’t know how old their roof is, making it even harder to detect aging systems before they fail. Meanwhile, 12% admitted they would delay repairs indefinitely, further increasing their risk of property damage.
Severe Convective Storms: The Growing Catastrophe Risk
This blind spot compounds known risks: prior ZestyAI analysis has identified over 12.6 million U.S. properties at high risk for hail-related roof damage, representing $189.5 billion in potential roof replacement costs.
“Deferred maintenance has long been a known risk factor, but today the stakes are higher than ever,” said Kumar Dhuvur, Co-Founder and Chief Product Officer of ZestyAI. "With claim severity rising and storm losses compounding, insurers need more than hazard maps to navigate this landscape."
"Property-level insights allow carriers to proactively address known vulnerabilities, improve underwriting precision, and work with homeowners to reduce losses before they happen.”
ZestyAI’s findings support a growing push toward data-driven, preventative underwriting strategies, especially as carriers face rising claim severity and pressure to improve combined ratios across storm-prone states.
See How Insights Turn Into Decisions
ZestyAI transforms data into action. Get a demo to see how the same AI powering our reports helps carriers make faster, smarter, regulator-ready decisions.